Fig. 4
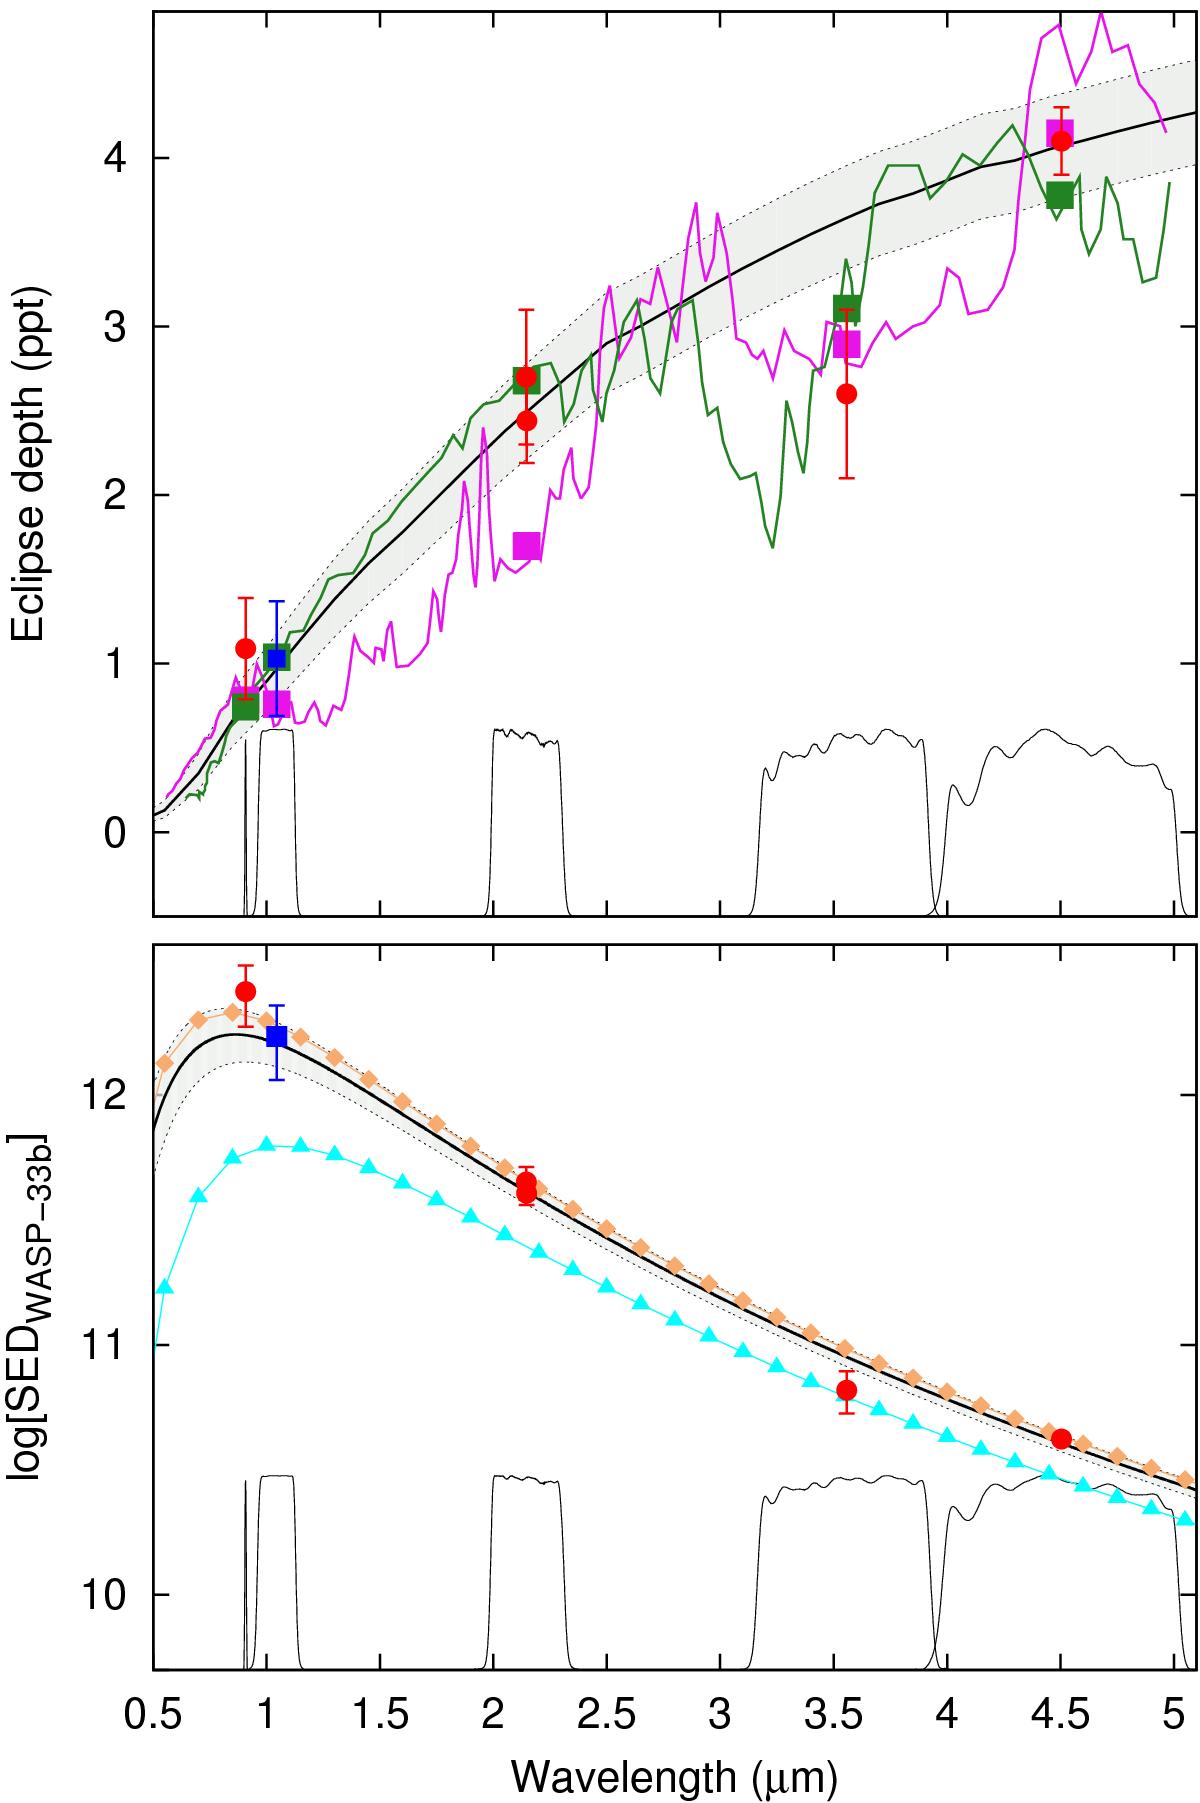
Top: eclipse depth in ppt as a function of wavelength. The blue data point indicates our brightness temperature measurement, while the red circles show literature values. The gray area shows 1σ contour of WASP-33 b’s equilibrium temperature. Green continuous line corresponds to Deming et al. (2012)’s carbon-rich non-inverted model, while pink continuous line indicates a solar composition model with an inverted temperature structure. Squares mark the planetary fluxes integrated over the bandpasses. Bottom: the same data after multiplication by the PHOENIX stellar model revealing the SED for WASP-33 b. Overplotted are the expected SEDs for a zero-albedo instantly re-radiation (orange diamonds, f = 2/3) and instantly redistribution (cyan triangles, f = 1/4) day-sides.
Current usage metrics show cumulative count of Article Views (full-text article views including HTML views, PDF and ePub downloads, according to the available data) and Abstracts Views on Vision4Press platform.
Data correspond to usage on the plateform after 2015. The current usage metrics is available 48-96 hours after online publication and is updated daily on week days.
Initial download of the metrics may take a while.