Fig. 1
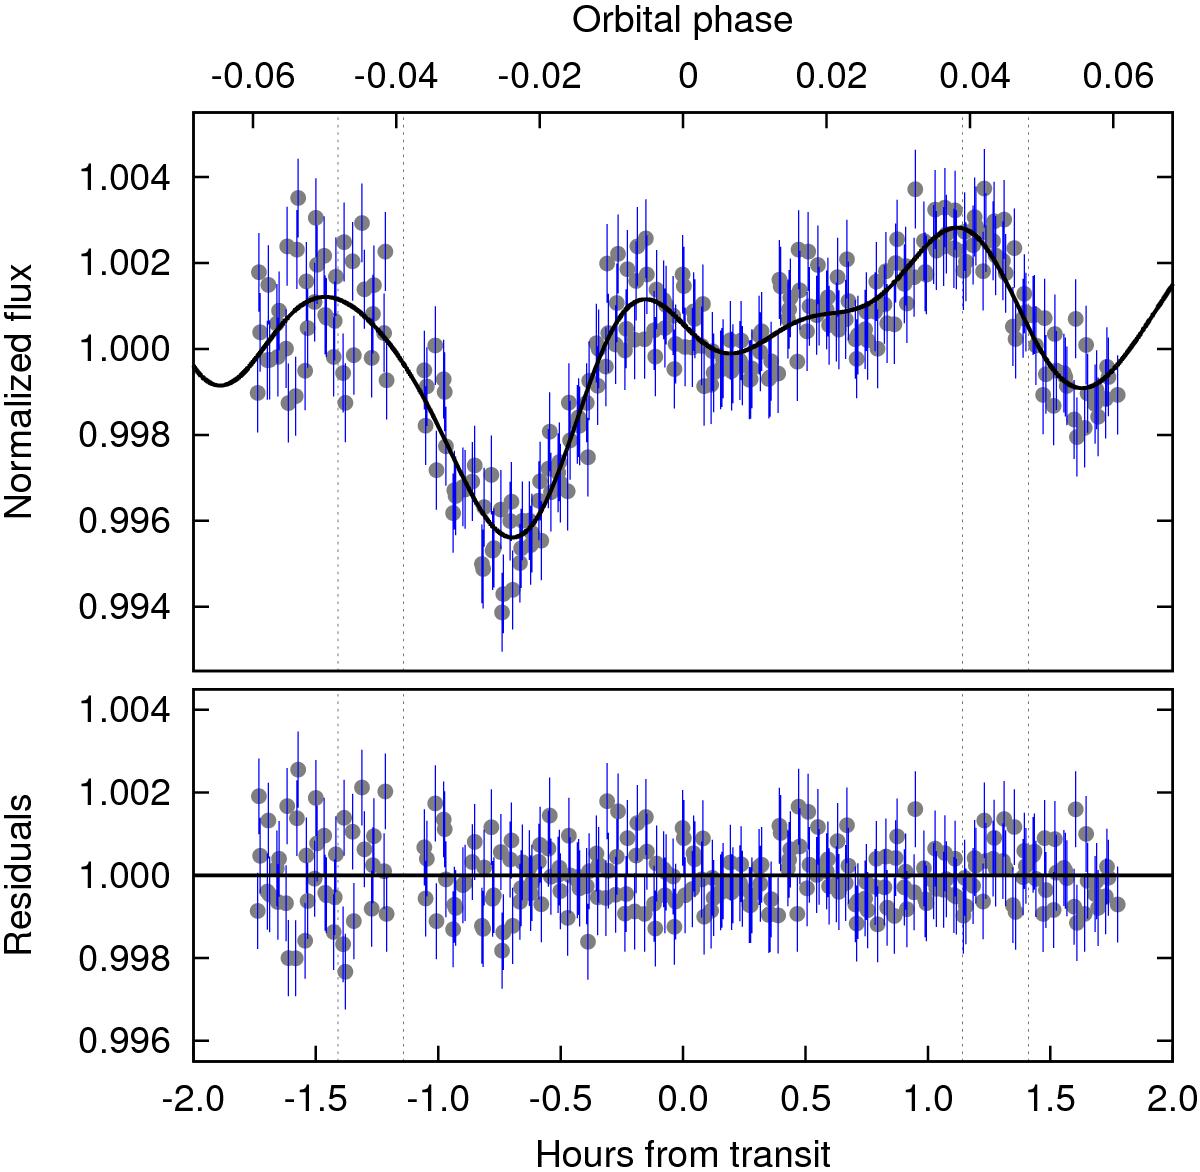
LBT V optical data during secondary eclipse of WASP-33 b as a function of the orbital phase and the hours relative to mid-eclipse. Top: normalized flux. The continuous black line shows the best-fitting model (24+3 parameters). The error bars were enlarged to meet the scatter of the data. Bottom: residual light curve. Vertical dashed lines indicate first to fourth contacts assuming a circular orbit (Deming et al. 2012).
Current usage metrics show cumulative count of Article Views (full-text article views including HTML views, PDF and ePub downloads, according to the available data) and Abstracts Views on Vision4Press platform.
Data correspond to usage on the plateform after 2015. The current usage metrics is available 48-96 hours after online publication and is updated daily on week days.
Initial download of the metrics may take a while.