Fig. 17
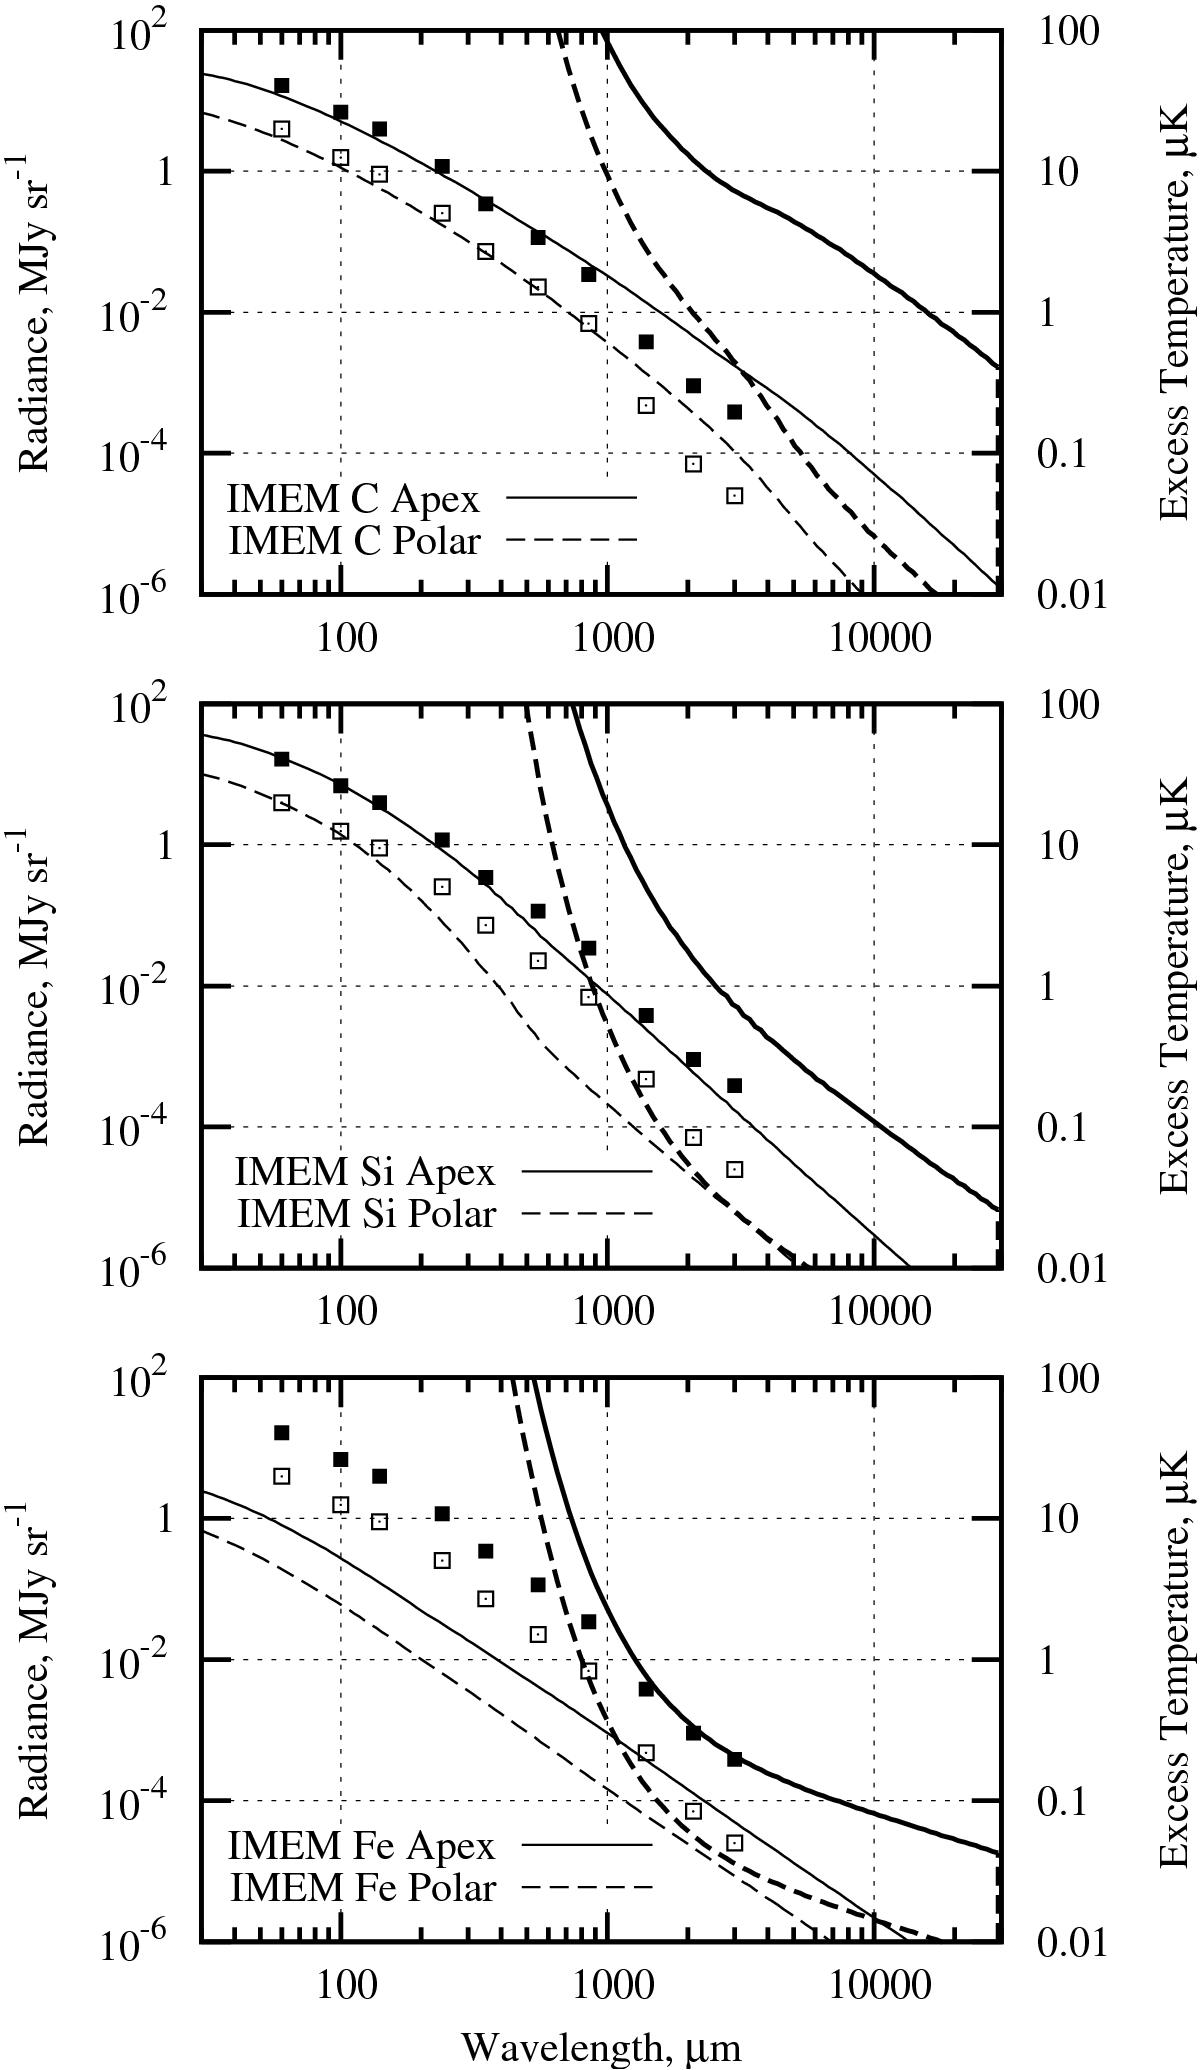
Thermal emission spectra of the zodiacal cloud predicted by IMEM for the apex of Earth’s motion around the Sun and the ecliptic pole, assuming that the dust particles are composed of amorphous carbon (top), silicate (middle), and iron (bottom) material. Thick curves are the excess temperatures with respect to the blackbody emission of the CMB (right scale), thin curves are the absolute intensities of emission (left scale). Also plotted are the absolute intensities of the Kelsall model for the wavelengths at which it was normalized to the observations (squares, see Fig. 15 for description).
Current usage metrics show cumulative count of Article Views (full-text article views including HTML views, PDF and ePub downloads, according to the available data) and Abstracts Views on Vision4Press platform.
Data correspond to usage on the plateform after 2015. The current usage metrics is available 48-96 hours after online publication and is updated daily on week days.
Initial download of the metrics may take a while.