Free Access
Fig. 8
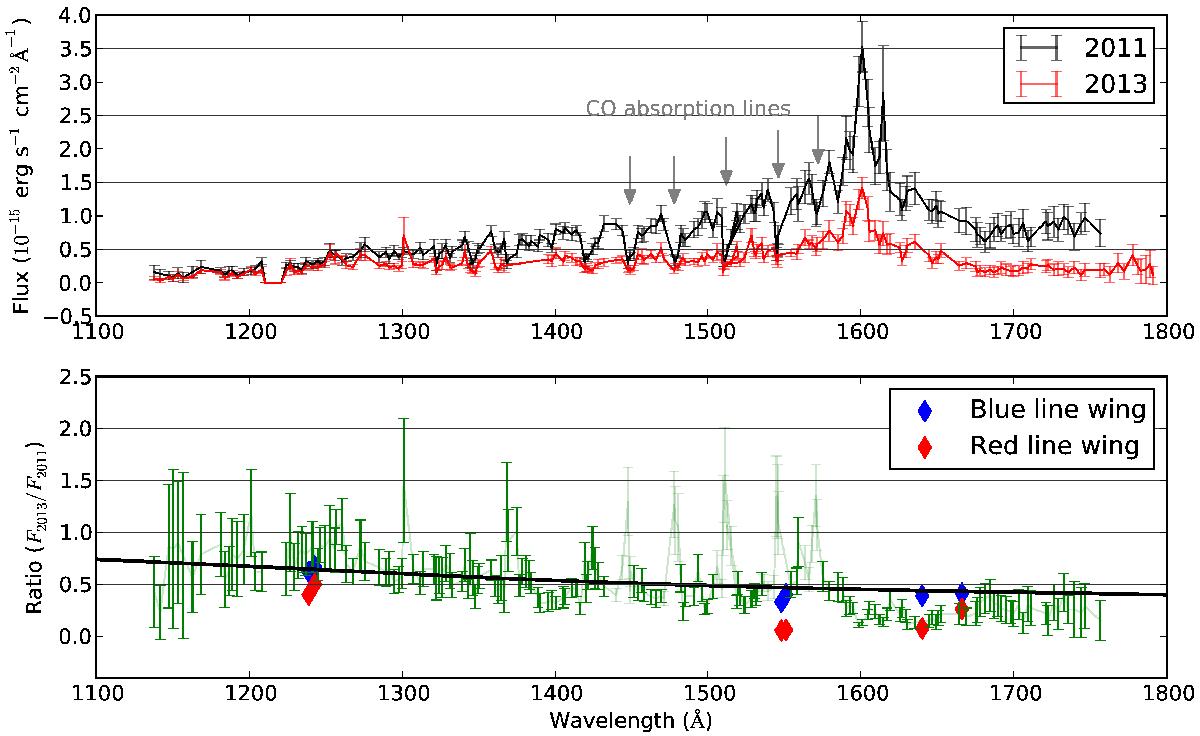
Top panel: FUV continuum of AA Tau. The CO absorption lines are visible. The bump at 1600 Å is also visible. Bottom panel: ratio between both epochs and the ratio between the two transmission curves discussed in the text. Overplotted are the blue and red parts of atomic emission lines.
Current usage metrics show cumulative count of Article Views (full-text article views including HTML views, PDF and ePub downloads, according to the available data) and Abstracts Views on Vision4Press platform.
Data correspond to usage on the plateform after 2015. The current usage metrics is available 48-96 hours after online publication and is updated daily on week days.
Initial download of the metrics may take a while.