Free Access
Fig. 7
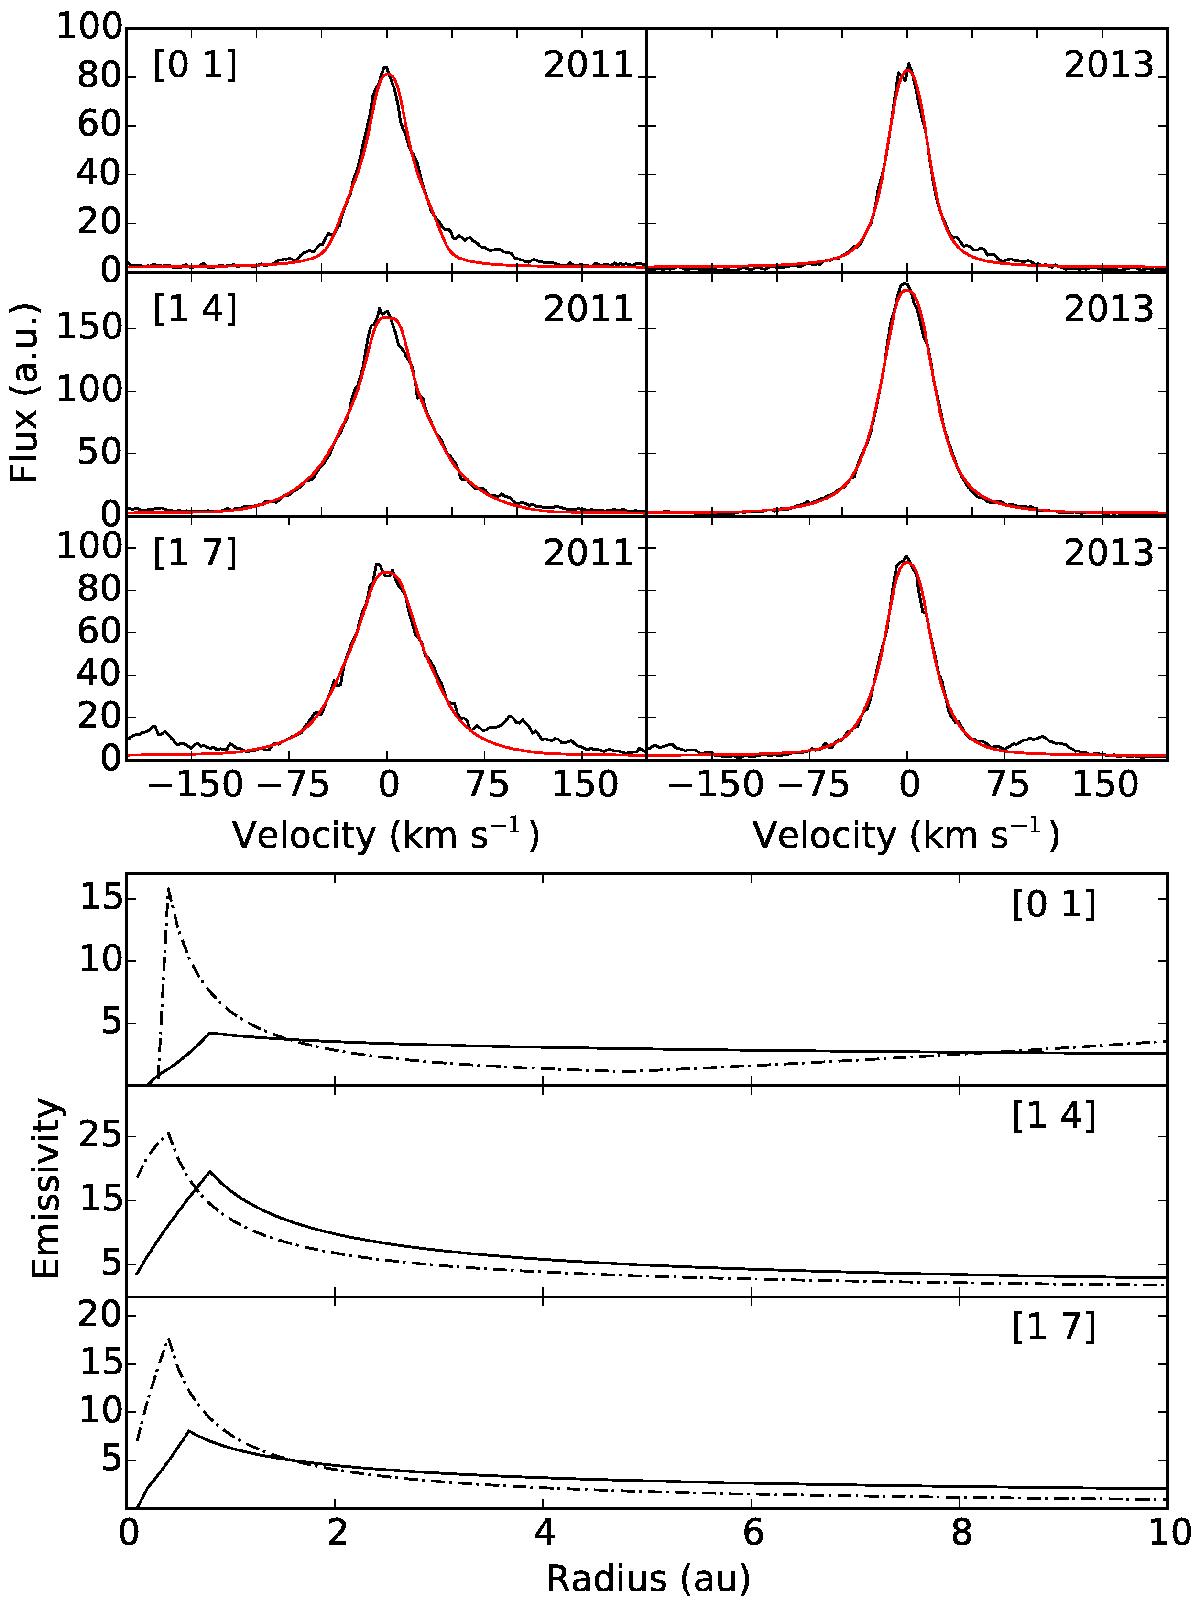
Modeled H2 emission lines and emissivity of the disk for the different models. Top: data and model for individual progressions. Bottom: disk emissivity. The 2011 model is shown dash-dotted and the 2013 is the solid curve. Details are given in Sect. 7.2.
Current usage metrics show cumulative count of Article Views (full-text article views including HTML views, PDF and ePub downloads, according to the available data) and Abstracts Views on Vision4Press platform.
Data correspond to usage on the plateform after 2015. The current usage metrics is available 48-96 hours after online publication and is updated daily on week days.
Initial download of the metrics may take a while.