Fig. 6
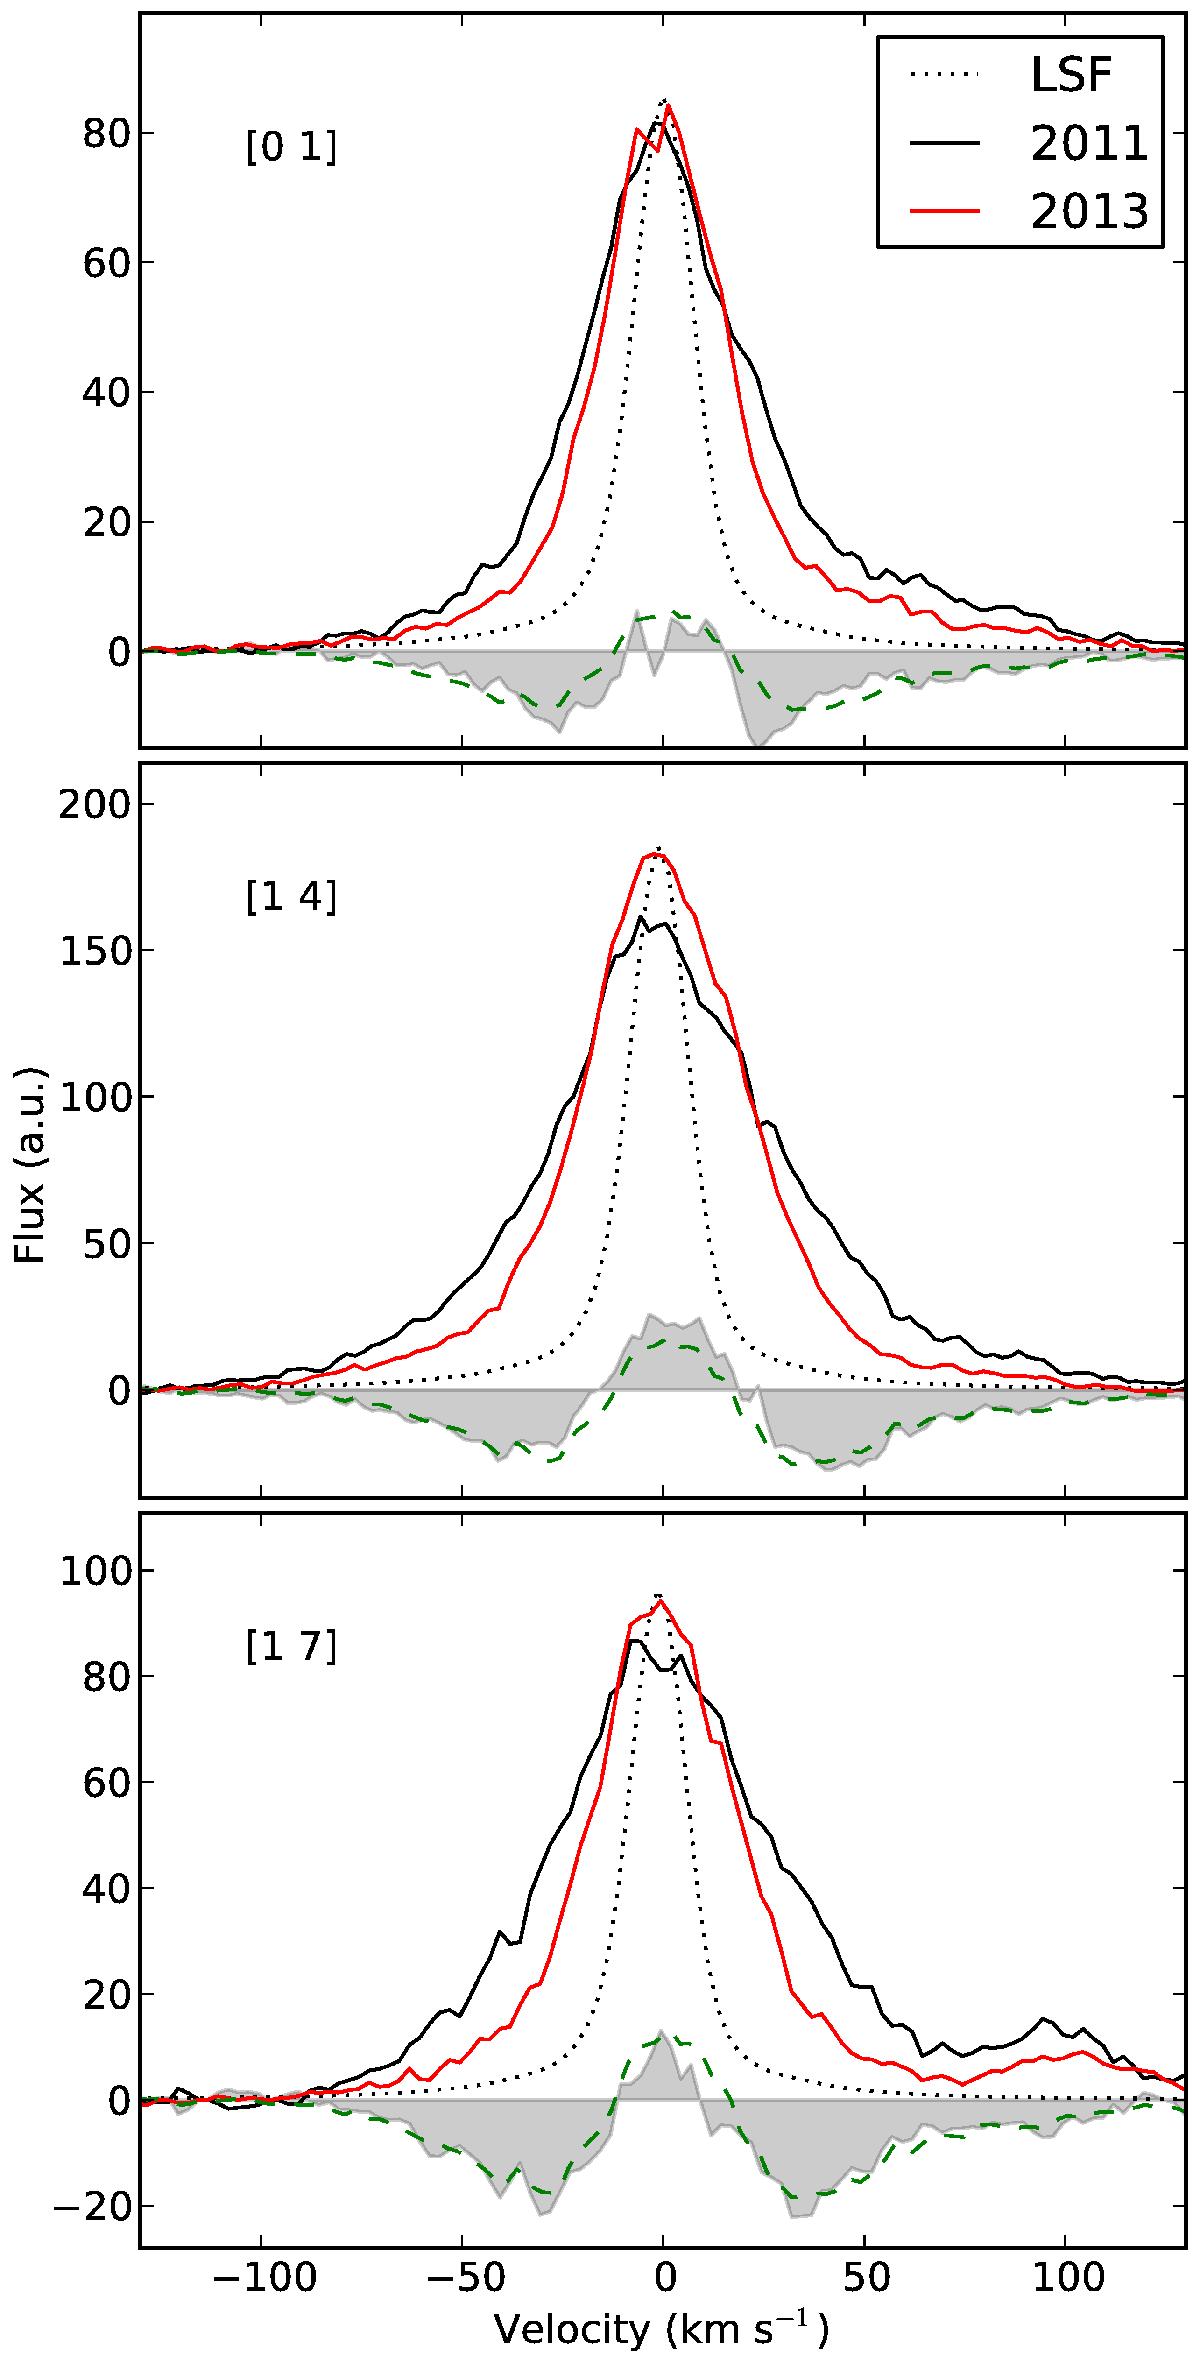
Flux reduction in the high velocity wing of the three strongest H2 progressions. Several lines of the respective progressions have been co-added (to avoid uncertainties in the wavelength calibration, the lines have been shifted to a common zero velocity before co-addition). The shaded area indicates the difference between the two epochs. The mean difference scaled to fit the individual results is shown as the green, dashed curve. An approximate LSF is also shown.
Current usage metrics show cumulative count of Article Views (full-text article views including HTML views, PDF and ePub downloads, according to the available data) and Abstracts Views on Vision4Press platform.
Data correspond to usage on the plateform after 2015. The current usage metrics is available 48-96 hours after online publication and is updated daily on week days.
Initial download of the metrics may take a while.