Fig. 5
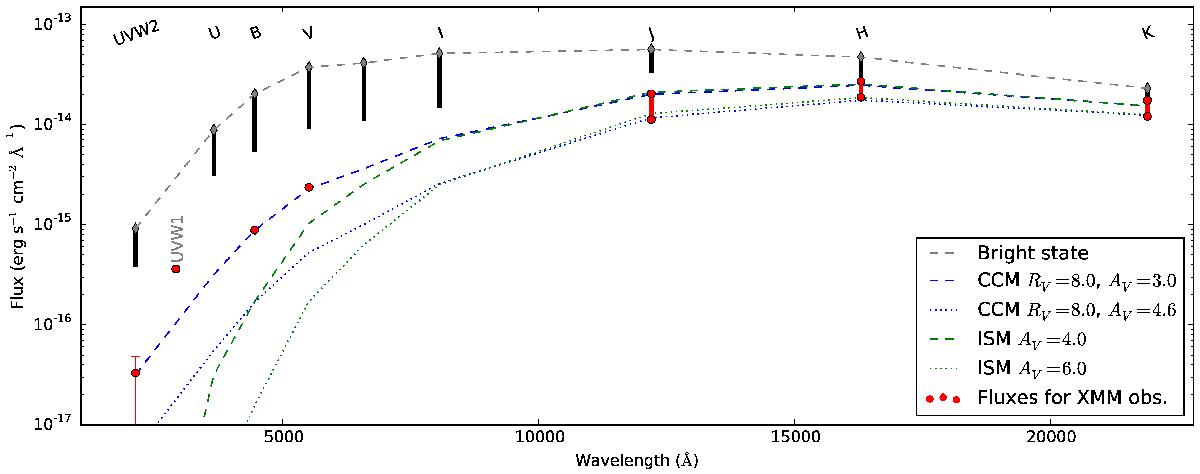
Fluxes for the AA Tau system during the bright and dim state. During the bright state the observed photospheric emission was modulated by the inner warp and the gray bars indicate the ranges for each filter. The fluxes during the XMM-Newton observation are shown as red circles. The red bars indicate the range of NIR magnitudes observed during the dim state. The gray, dashed line indicates the uneclipsed SED during the bright state for comparison with the dim state during the XMM-Newton observation. Finally, the blue and green lines (dashed and dotted) show the expected flux distribution taking the gray line as the reference assuming different extinction laws (CCM refers to the Cardelli et al. 1989, extinction law).
Current usage metrics show cumulative count of Article Views (full-text article views including HTML views, PDF and ePub downloads, according to the available data) and Abstracts Views on Vision4Press platform.
Data correspond to usage on the plateform after 2015. The current usage metrics is available 48-96 hours after online publication and is updated daily on week days.
Initial download of the metrics may take a while.