Fig. 5
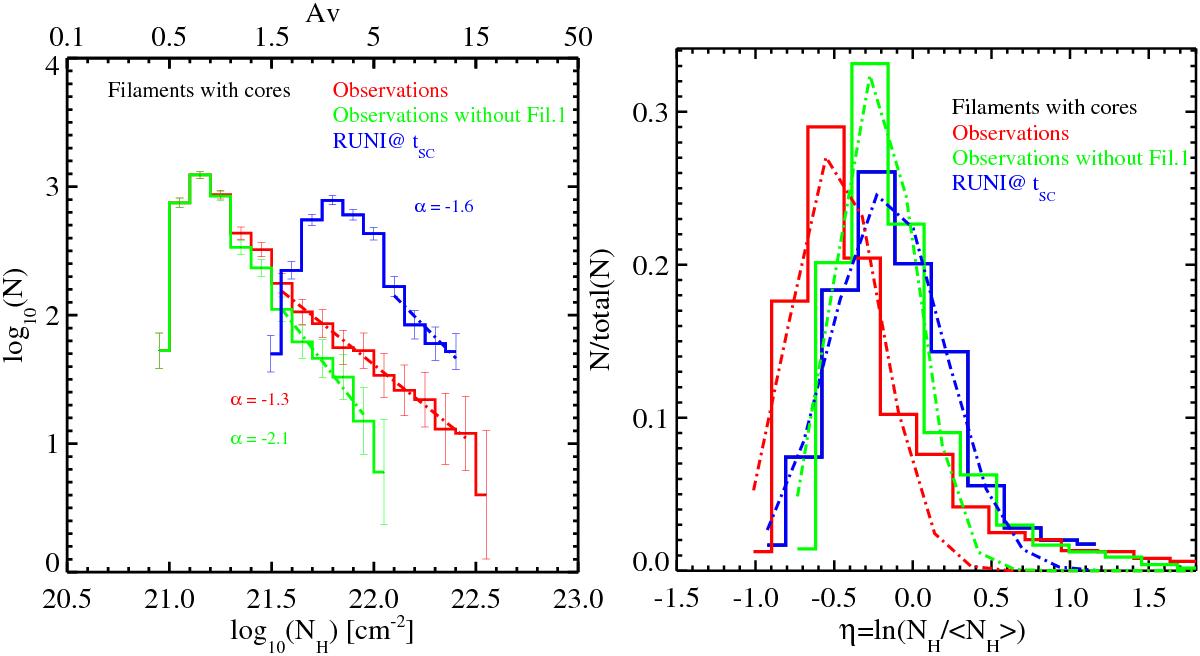
Left panel: histograms of the column density distributions, right panel: normalized PDFs of the filaments with cores. The dash-dotted lines overplotted on the PDFs show the best Gaussian fit of the data. The red lines are for the observations, blue for the simulations, and green for the observations without filament 1. The positions of the observed filaments and cores are highlighted in Fig. 2, while the simulated filaments and cores are outlined in Fig. 3.
Current usage metrics show cumulative count of Article Views (full-text article views including HTML views, PDF and ePub downloads, according to the available data) and Abstracts Views on Vision4Press platform.
Data correspond to usage on the plateform after 2015. The current usage metrics is available 48-96 hours after online publication and is updated daily on week days.
Initial download of the metrics may take a while.