Fig. 4
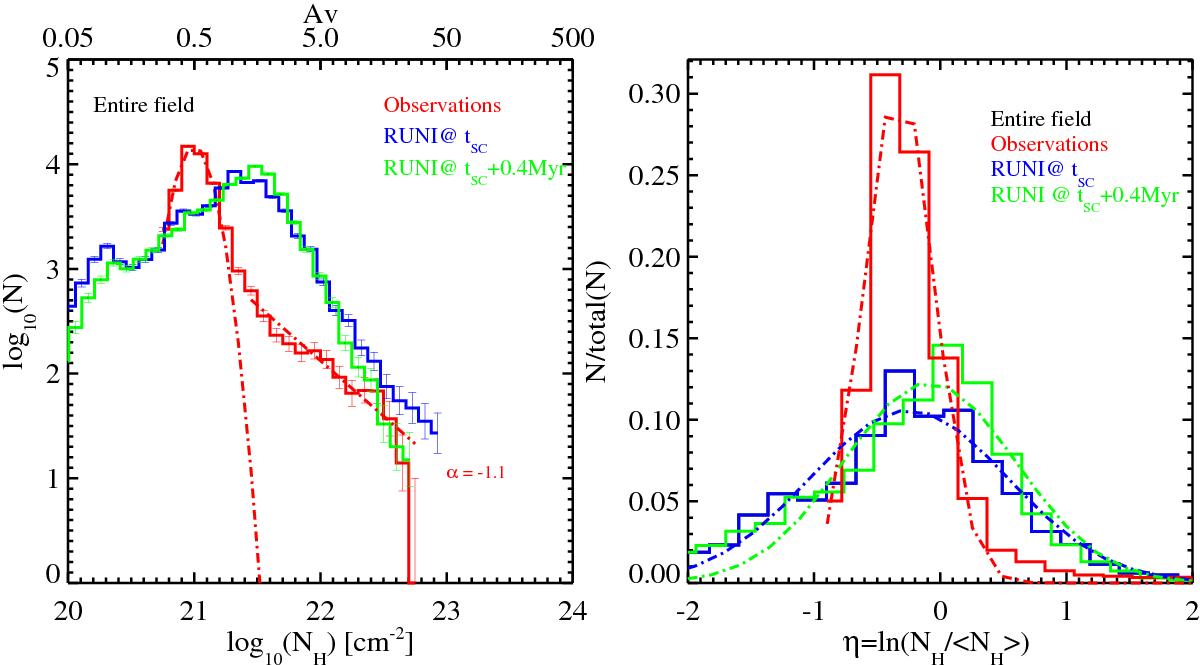
Left panel: column density distributions and the right panel the normalized PDFs of the Serpens core (in red) and two snapshots of Run I of the simulations of Dale et al. (2012) that differ by 0.4 Myr in time (in blue and green). The snapshot at tSC is shown in Fig. 3. The dash-dotted red lines in the left panel show the fit of a Gaussian distribution and a power law. In the right panel the dash-dotted lines show the best Gaussian fit of the observations (in red), Run I at tSC (in blue), and Run I at tSC+0.4 Myr (in green).
Current usage metrics show cumulative count of Article Views (full-text article views including HTML views, PDF and ePub downloads, according to the available data) and Abstracts Views on Vision4Press platform.
Data correspond to usage on the plateform after 2015. The current usage metrics is available 48-96 hours after online publication and is updated daily on week days.
Initial download of the metrics may take a while.