Fig. 2
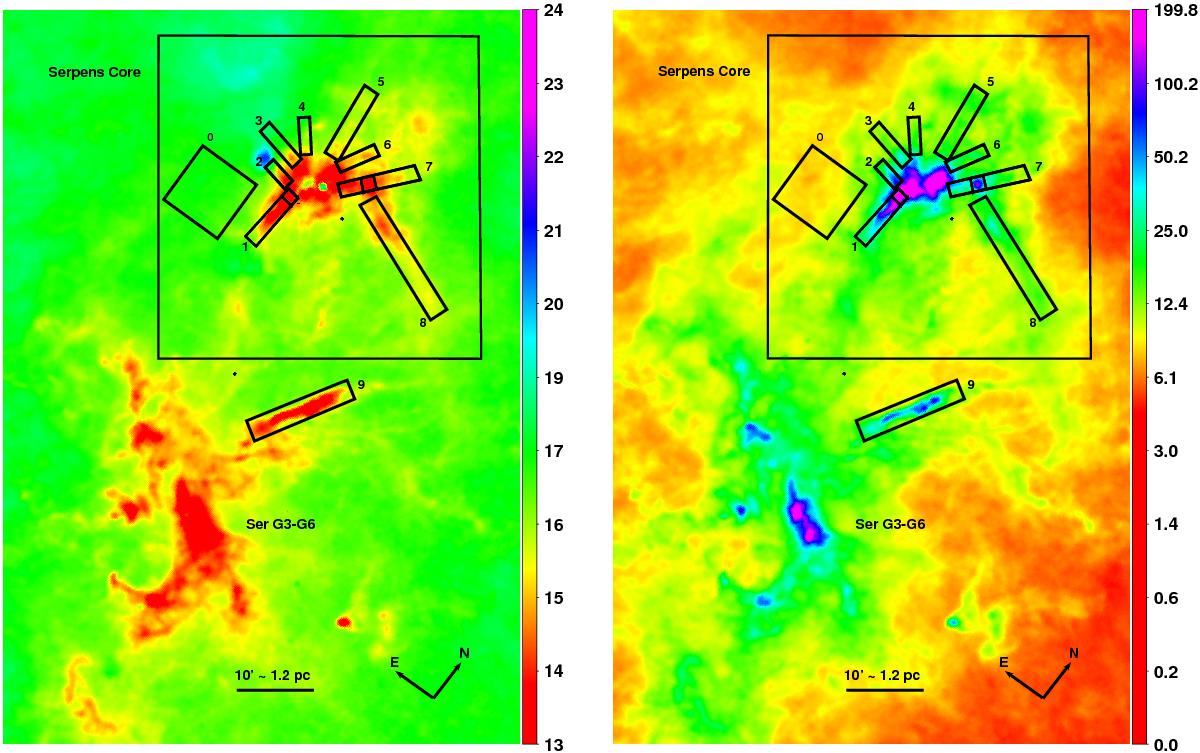
Left: temperature map of the Serpens core in K. Right: column density map (NH) of the Serpens core in [×10+20 cm-2]. The center of the image corresponds to the position (αJ2000,δJ2000) = (18h 29m 18s, + 00° 51′ 08′′) and the size is 94′ × 67′. In both panels the large boxes define the position of the whole Serpens core. The nine filaments considered in our analysis are indicated by numbered boxes. In filaments 1 and 7 the small squared boxes give the positions of the cores. Box 0 represents the control field.
Current usage metrics show cumulative count of Article Views (full-text article views including HTML views, PDF and ePub downloads, according to the available data) and Abstracts Views on Vision4Press platform.
Data correspond to usage on the plateform after 2015. The current usage metrics is available 48-96 hours after online publication and is updated daily on week days.
Initial download of the metrics may take a while.