Fig. 1
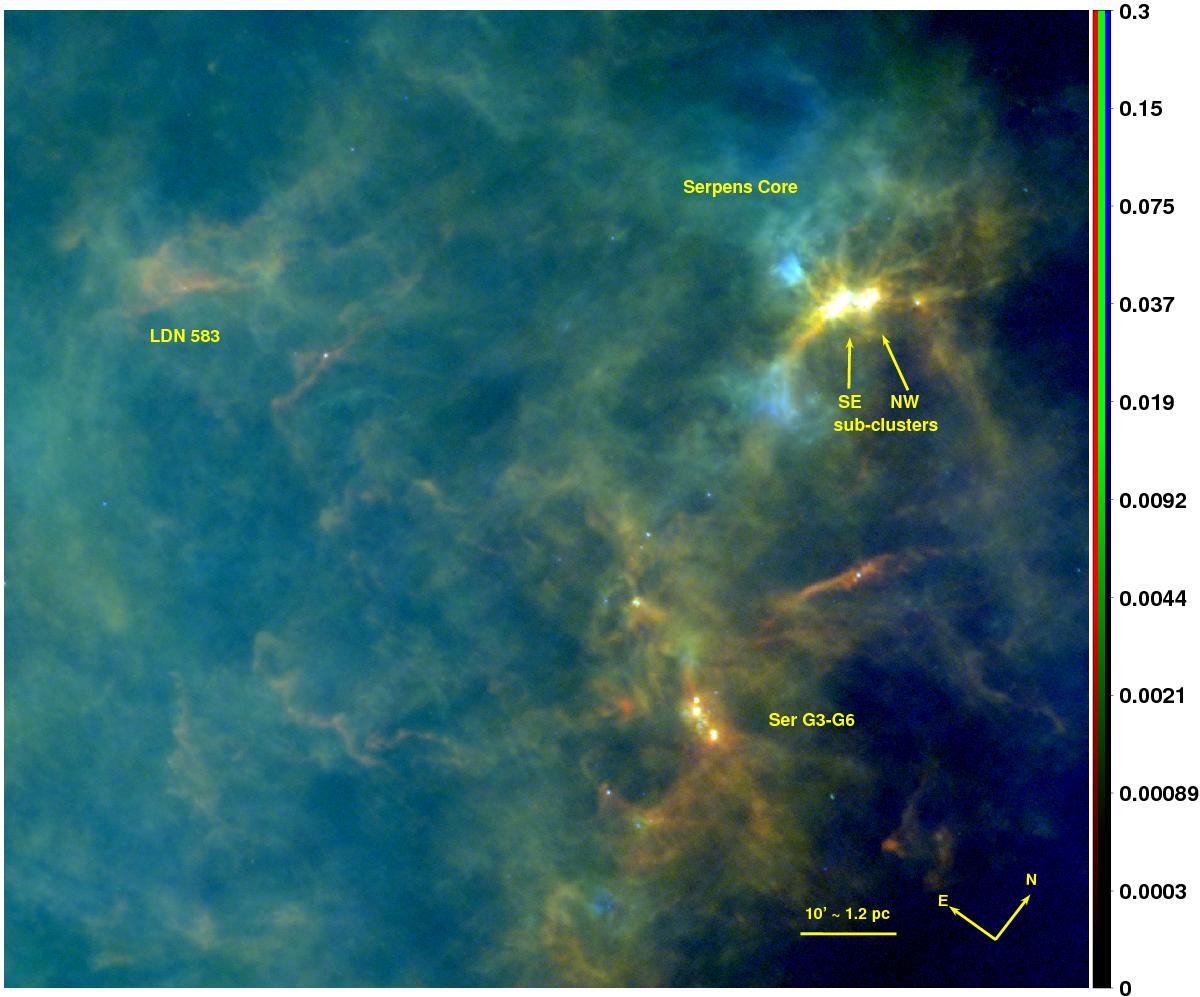
Composite Herschel/PACS 70 μm (blue), 160 μm (green), and Herschel/SPIRE 350 μm (red) mosaics in logarithmic scale. The ranges are between 0 and 0.3 Jy/arcsec2, 0 and 0.3 Jy/arcsec2, and 0 and 0.05 Jy/arcsec2 for the blue, green, and red image, respectively. The center of the figure corresponds to the position (αJ2000,δJ2000) = (18h 30m 49s, + 00° 39′ 24′′) and the size of the region is 1.7° × 1.9°.
Current usage metrics show cumulative count of Article Views (full-text article views including HTML views, PDF and ePub downloads, according to the available data) and Abstracts Views on Vision4Press platform.
Data correspond to usage on the plateform after 2015. The current usage metrics is available 48-96 hours after online publication and is updated daily on week days.
Initial download of the metrics may take a while.