| Issue |
A&A
Volume 584, December 2015
|
|
|---|---|---|
| Article Number | A114 | |
| Number of page(s) | 9 | |
| Section | Extragalactic astronomy | |
| DOI | https://doi.org/10.1051/0004-6361/201425149 | |
| Published online | 02 December 2015 | |
Arp 65 interaction debris: massive H I displacement and star formation
1 Korea Astronomy and Space Science Institute, 776, Daedeokdae ro, Yuseong gu, 305-348 Daejeon, Republic of Korea
e-mail: This email address is being protected from spambots. You need JavaScript enabled to view it.
2 Institute of Astrophysics and Space Sciences (IA), Rua das Estrelas, 4150-762 Porto, Portugal
3 Centre for Astrophysics Research, University of Hertfordshire, College Lane, Hatfield, AL10 9AB, UK
4 National Centre for Radio Astrophysics, Tata Institute of Fundamental Research, 411 007 Pune, India
5 Cotton College State University, Panbazar, 781 001 Guwahati, India
6 Raman Research Institute, 560 080 Bangalore, India
Received: 13 October 2014
Accepted: 24 August 2015
Abstract
Context. Pre–merger tidal interactions between pairs of galaxies are known to induce significant changes in the morphologies and kinematics of the stellar and interstellar medium components. Large amounts of gas and stars are often found to be disturbed or displaced as tidal debris. This debris then evolves, sometimes forming stars and occasionally forming tidal dwarf galaxies. Here we present results from our H i study of Arp 65, an interacting pair hosting extended H i tidal debris.
Aims. In an effort to understand the evolution of tidal debris produced by interacting pairs of galaxies, including in situ star and tidal dwarf galaxy formation, we are mapping H i in a sample of interacting galaxy pairs. The Arp 65 pair is the latest member of this sample to be mapped.
Methods. Our resolved H i 21 cm line survey is being carried out using the Giant Metrewave Radio Telescope. We used our H i survey data as well as available SDSS optical, Spitzer infra-red and GALEX UV data to study the evolution of the tidal debris and the correlation of H i with the star-forming regions within it.
Results. In Arp 65 we see a high impact pre–merger tidal interaction involving a pair of massive galaxies (NGC 90 and NGC 93) that have a stellar mass ratio of ~1:3. The interaction, which probably occurred ~1.0–2.5 × 10⁸ yr ago, appears to have displaced a large fraction of the H i in NGC 90 (including the highest column density H i) beyond its optical disk. We also find extended on-going star formation in the outer disk of NGC 90. In the major star-forming regions, we find the H i column densities to be ~4.7 × 1020 cm-2 or lower. But no signature of star formation was found in the highest column density H i debris SE of NGC 90. This indicates conditions within the highest density H i debris remain hostile to star formation and it reaffirms that high H i column densities may be a necessary but not sufficient criterion for star formation.
Key words: galaxies: individual: Arp 65 / galaxies: interactions / radio lines: ISM / galaxies: star formation / galaxies: ISM / galaxies: groups: general
© ESO, 2015
 Open Access article, published by EDP Sciences, under the terms of the Creative Commons Attribution License (http://creativecommons.org/licenses/by/4.0),
which permits unrestricted use, distribution, and reproduction in any medium, provided the original work is properly cited.
Open Access article, published by EDP Sciences, under the terms of the Creative Commons Attribution License (http://creativecommons.org/licenses/by/4.0),
which permits unrestricted use, distribution, and reproduction in any medium, provided the original work is properly cited.
1. Introduction
Tidal interactions between pairs of galaxies before their merger are known to induce significant changes in the morphologies and kinematics of the stellar and interstellar medium (ISM) components on both large and small scales (Wielen 1990; Struck et al. 2005; Chien et al. 2007). Observations of pre-merger interacting pairs of galaxies provide the opportunity to investigate the way in which major tidal interactions affect the evolution of galaxies, including the impact on the rates and location of star formation (SF) as well as the morphological and kinematic responses of their stellar and ISM components. The “Tails and Bridges” sample from Smith et al. (2007), drawn from the Arp atlas of interacting galaxies, contains a sample of nearby relatively isolated interacting pairs of galaxies. The pairs in the Smith sample are observed at various stages before merging. In our resolved 21 cm H i line studies of Arp pairs with the Giant Metrewave Radio telescope (GMRT) we are focusing on the impacts of these interactions on the H i morphology and kinematics of late-type galaxies (spirals), paying special attention to star formation in the low-density tidal debris and tidal dwarf galaxy (TDG) formation (Sengupta et al. 2012, 2013, 2014).
The Arp 65 pair (Fig. 1, left) consists of two large spirals, NGC 90 and NGC 93. NGC 90 is a grand design barred spiral (SABc) with impressively enhanced spiral arms and long tidal tails to the north-west (NW) and south-east (SE). NGC 93 (spiral) is the more massive of the pair in terms of stellar mass and is projected about 3.0′ (64 kpc) to the east of NGC 90. The galaxies are catalogued as members of the SRGb063 galaxy group, (Fig. 1, right) n (number of members) = 45, Vopt = 5771 km s-1 (Mahdavi & Geller 2004). NGC 90 is projected ~3.3′ (70 kpc) to the east of the group’s intra-group medium (IGM) centroid based on X-ray observations by Mahdavi & Geller (2004). Further basic properties of the pair are given in Table 1.
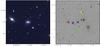 |
Fig. 1 Left: Arp 65 pair: SDSS g, r, i-band false-colour image. The galaxy at the centre of the image is NGC 90 and the galaxy of similar size at the eastern edge of the image is NGC 93. Right: SRGb063 group: SDSS r-band image of the Arp 65 pair in the SRGb063 group. The blue and the red crosses are NGC 90 and NGC 93 respectively. Crosses with other colours represent nearby massive group members: CGCG 479-012 (green), NGC 85B (yellow), NGC 80 (orange). The black X marks the X-ray centroid of SRGb063 group from Mahdavi et al. (2000). |
Properties of the Arp 65 pair.
We present here results from our GMRT H i observations of the Arp 65 system. In addition to the H i data from the GMRT, we have used the Sloan Digital Sky Survey (SDSS), Spitzer and Galaxy Evolution Explorer (GALEX) public archive data and images to understand the relation between the gaseous and stellar components of the system. The paper is set out as follows. Section 2 gives details of the GMRT observations, with observational results in Sect. 3. A discussion follows in Sect. 4 with concluding remarks in Sect. 5. The optical heliocentric radial velocities of NGC 90 and NGC 93 are respectively 5197 km s-1 and 5643 km s-1 (Hyperleda1). Using the average radial velocity (5420 km s-1) and assuming H0 to be 75 km s-1 Mpc-1, we estimate the distance to Arp 65 pair to be 73 Mpc. Based on this distance the spatial scale is ~21.2 kpc per arcmin.
2. Observations
H i 21 cm line observations of Arp 65 were carried out using the GMRT on 15 March, 2009. Further details of the observations are given in Table 2. The baseband bandwidth used was 16 MHz for the H i observations giving a velocity resolution of ~27 km s-1. The Astronomical Image Processing System (AIPS) software package was used for data reduction. Bad data from malfunctioning antennas and antennas with low gain and/or radio frequency interference were flagged. The flux densities are on the scale of Baars et al. (1977), with flux density uncertainties of ~5%. After calibration, continuum subtraction in the uv domain was carried out using the AIPS tasks uvsub and uvlin. The task imagr was then used to obtain the final cleaned H i image cubes. The integrated H i and H i velocity field maps were extracted from the cube using the AIPS task momnt. To analyse the H i structures, image cubes of different resolutions were produced by applying different “tapers” to the data with varied u,v limits.
3. Observational results
3.1. H I content and distribution
The top panel of Fig. 2 shows the low-resolution integrated H i contours (in white) overlaid on an SDSS r-band image for Arp 65. The blue contours in the figure show the far-ultraviolet (FUV) emission from GALEX. The bulk of the H i detected in this system is associated with the SABc galaxy NGC 90. The other member of the pair, NGC 93 appears to be a more evolved spiral with a redder SDSS g–i colour of 1.58 compared to NGC 90 (SDSS g–i = 1.4). H i is only marginally detected in NGC 93. The most striking feature in the low-resolution map is that the H i intensity maximum and the bulk of the H i is projected ~1 arcmin (21 kpc) to the south-east of the NGC 90 optical centre and beyond its optical disk.
GMRT observation details.
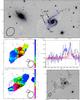 |
Fig. 2 Arp 65. Top: integrated H i intensity contours (white) on SDSS r-band image. The blue contours are FUV from GALEX. The H i column density levels are 1020 cm-2× (0.6, 1.2, 1.8, 2.9, 4.7, 5.9, 7.2). Middle left: the H i velocity field for NGC 90, in colour. The black contour shows the GALEX FUV extent NGC 90. The red contour is the H i 0.6 × 1020 cm-2 contour from the top panel. Middle right: H i spectra for NGC 90: GMRT (black) and single dish (blue) from Springob et al. (2005). NGC 93: single dish spectrum (red) Springob et al. (2005) spectrum for NGC 93. The optical velocities of NGC 90 and NGC 93 are marked with dashed lines. Bottom left: velocity field of the low-velocity component, overlaid with of the total intensity contours of the high-velocity component (blue) and FUV contours (black) define the edge of the galaxy. Bottom right: high-resolution H i intensity contours (black) overlaid on low-resolution H i intensity contours (white) and SDSS r-band image. The low-resolution contours are same as the top panel. The high-resolution contours are 1020 cm-2 × (1.5,4.6,8.3). For each of the maps the beam size is shown by a black ellipse at bottom of each map. |
The integrated H i flux density obtained by Springob et al. (2005) from single-dish observations for NGC 90 was 5.4 Jy km s-1 as compared to 4.9 Jy km s-1 from our GMRT observations, meaning that the GMRT recovered ~90% of single-dish H i flux density. Conversion of the single dish flux density to an H i mass gives MH I = 6.8 × 10⁹ M⊙. We use this H i mass derived from the single-dish observations for all our calculations requiring the NGC 90 H i mass. The single-dish H i flux density for NGC 93 was 1.46 Jy km s-1 (Springob et al. 2005). However the marginal H i detection for NGC 93 in our GMRT map (Fig. 2, top panel), the Arecibo beam size (~3.5 arcmin) and the coincidence in velocity of flux maxima in the Arecibo spectrum of NGC 93 (in red) with the high-velocity horn of the GMRT spectrum (in black) for NGC 90 (Fig. 2, middle right panel) leads us to conclude that most of H i flux in the NGC 93 Arecibo single-dish spectrum is in fact H i spatially associated with NGC 90.
The middle right panel of Fig. 2 also shows H i spectra for NGC 90 from both the GMRT (in black) and the single-dish (in blue) observations. The single-dish spectrum has VH I = 5333 km s-1 and W20 = 477 km s-1 (Springob et al. 2005). This W20 value is ~45 km s-1 higher than an estimate of W20 based on the M ∗ values in Sect. 4.1 and Eq. (19) in Torres-Flores et al. (2011). The GMRT resolved images and channel maps provide insights into the enhancement of the line width. The middle left panel of Fig. 2 shows the velocity field for H i for NGC 90 (colour scale) overlaid with the FUV (GALEX) contours (in black). The red contour line shows the H i extent (3σ) from the GMRT low-resolution integrated H i map. West of the NGC 90 optical centre the velocity field indicates a more or less regular velocity gradient. But the eastern part of the disk shows an anomalous velocity behaviour. The separation between high- and low-velocity components in the channel maps (Fig. 5) is indicated by the lack of H i detections between 5347 km s-1 and 5402 km s-1. A gas blob appears SE of NGC 90 at velocities >5000 km s-1 and moves NW across the optical disk with a velocity increasing up to ~5320 km s-1. At around 5480 km s-1 another blob appears SE of the NGC 90 optical disk and remains detected there at velocities up to 5650 km s-1. Based on the channel maps, we divided the high- and low-velocity components of NGC 90 at 5350 km s-1. The bottom left panel of Fig. 2 shows the velocity field of the low-velocity component, overplotted with the total intensity contours (in blue) of the high-velocity component and the FUV (GALEX) contours (in black) defining the edge of the optical galaxy. The H i velocity field for low-velocity component H i in NGC 90 presents as a disk with fairly regular rotation and no significant asymmetry. This velocity field shows that the H i velocity at the optical centre of NGC 90 is ~5188 km s-1 (Voptical = 5197 ± 25) and its rotation velocity is ~100 km s-1, before adjustment for inclination. No sign of regular rotation is found in the velocity field for the high-velocity component, referred to as the “SE high-velocity H i mass” from now on. This separation of high- and low-velocity gas is also clearly seen in the position-velocity (pv) diagram (Fig. 3). The signal-to-noise ratio (S/N) is poor in the pv diagram, but it successfully shows the gradient in the disk of NGC 90 and the lack of a velocity gradient in the SE high-veloctiy gas mass. About 50% of the total H i mass of 6.8 × 10⁹ M⊙ can be attributed to the low-velocity component (NGC 90) implying ~3.4 × 10⁹ M⊙ for the SE high-velocity H i mass. We conclude that both the abnormally large H i line width and the perturbed H i morphology of NGC 90 are largely the result of the superposition of the SE high-velocity H i mass on the gas disk of NGC 90 that rotates with a lower velocity.
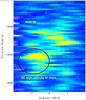 |
Fig. 3 Position-velocity (PV) diagram of the H i mass detected with NGC 90. Both the regular disk of NGC 90 and the SE high-velocity H i mass (within the black ellipse) are visible in the PV diagram. |
3.2. H I and star formation beyond the NGC 90 optical disk
As the top panel of Fig. 2 shows, NGC 90 hosts several star forming zones beyond its optical disk along the western tidal tail and east of the disk. The most prominent, labelled as SF1, SF2, and SF3, are visible in both the SDSS r-band and the FUV (GALEX) images. H i is detected at the positions of these star-forming zones, but without any evidence of local enhancement in H i flux density. The H i column densities2 in these star-forming zones are ~1.2–4.7 × 1020 cm-2. The high- and low-resolution H i maps both show the column density maxima projected at ~10 kpc east of the NGC 90 optical disk edge (within the SE high-velocity H i mass). The H i column density maxima from the high-resolution map (Fig. 2 bottom right panel) is ~7 to 8 × 1020 cm-2. There is no evidence of ongoing star formation at or near the position of H i column density maxima from the optical, UV or Spitzer 24 μm images.
GMRT H i observation results.
4. Discussion
In this discussion we consider what the observations to date, including our GMRT H i data, reveal about the interaction between the pair and SF in the tidal debris.
4.1. Evidence of an interaction between NGC 90 and NGC 93
The estimated stellar masses (M ∗) for NGC 90 and NGC 93 are ~4.9 × 10¹⁰ M⊙ and 1.4 × 10¹¹ M⊙ respectively, based on the parameters from Bell et al. (2003) and Blanton et al. (2003) for their SDSS r-band magnitudes and r–i colours. The M ∗ values for NGC 90 (including the tails) and NGC 93 derived from the formula in Eskew et al. (2012) using Spitzer 3.6 μm and 4.5 μm flux densities from Smith et al. (2007) are 4.4 × 10¹⁰ M⊙ and 1.4 × 10¹¹ M⊙ respectively. Both methods produce M ∗ values that agree well with each other and give a stellar mass ratio of ~1:3.
Interacting galaxy models and observations (e.g. Mihos 2001; Oh et al. 2008; Casteels et al. 2013) indicate enhanced stellar spiral arms as well as transitory tidal bridges and tails can result from prograde high-impact, low-velocity flyby encounters. Such interactions are expected to produce a long optical tidal tail on the far side and a bridge joining the pair on the near side (Mihos 2001). Strong arm enhancement is expected in bulge-dominated galaxies and a bar in disk-dominated galaxies. A stellar bridge is not visible between the NGC 90/93 pair, but a bar, prominent stellar arms and a far side tidal tail are observed in NGC 90 (Fig. 1, left panel).
Oh et al. (2008) used models to study the enhancement by a perturber of the optical spiral arms, tidal bridges and tidal tails (together with their visibility time-scales) in a disk galaxy. The baryonic mass of NGC 90 (~5.4 × 10¹⁰ M⊙) is close to that of the Oh model disk galaxy (~5.2 × 10¹⁰ M⊙), therefore it is reasonable to assume that the galaxy properties, including the dynamical times-cale, are sufficiently similar to make valid comparisons between the two, accepting that the orbital parameters remain poorly constrained compared to the Oh models. The Oh models use a tidal strength parameter,
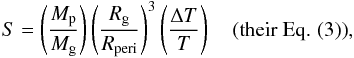 and investigate interactions with S< 0.3. For NGC 90 we can say the ratio of perturber to galaxy mass
  is ~3. But we have no direct constraint on the more important ratio of the peri-centre to galaxy radius
  variable or
  , the angular speed of the perturber relative to stars at the galaxy edge. In the Oh et al. (2008) models the tidal tails dissipate rapidly after reaching their most prominent phase 1.4 to 2.5 × 10⁸ yr after the interaction. But for S> 0.3 the tail dissipation time-scale may extend to ~1 Gyr and in this case the tail may fragment to form TDGs (Barnes 1992; Oh et al. 2008). However four pieces of evidence support an interaction within the times-cales derived from the Oh et al. (2008) models: (i) H i morphological perturbation signatures from a full merger of galaxies with total baryonic masses of the same order as NGC 90, only remain identifiable for a maximum of ~4 × 10⁸ yr to 7 × 10⁸ yr (Holwerda et al. 2011). It seems likely that H i perturbations from a full merger would be of the same order as the pre-merger interaction we observe in NGC 90. But because the H i morphology perturbations in NGC 90 are extreme compared to the Holwerda H i merger signature thresholds, it is reasonable to conclude the NGC 90 perturbation occurred well within the upper limits of the (Holwerda et al. 2011) times-cale; (ii) the projected distance between NGC 90 and NGC 93 is ~64 kpc. Assuming the separation velocity is the SRGb0063 group velocity dispersion of ~336 km s-1, we estimate the shortest possible time since their closest approach to be ~1.9 × 10⁸ yr ago; (iii) the time for a single rotation3 of NGC 90 is ~0.7 × 10⁹ yr, based on the ~180 km s-1 H i rotational velocity (inclination adjusted) of the low-velocity component and data from Table 2. A de–projected SDSS g-band image4 of NGC 90 indicates that the truncated bridge remnant is now offset ~60° counter-clockwise from a line joining the optical centres of NGC 90 and NGC 93. If we assume that the NGC 90/NGC 93 bridge formed along an axis joining the two galaxies soon after their closest approach, as interaction models predict, then the current ~60° offset (between a line joining the two galaxies and the bridge remnant) reflects the approximate fraction the time for single NGC 90 disk rotation since the bridge was formed. This then implies a time-scale since the interaction of ~1.2 × 10⁸ yr5; and (iv) the NGC 90 optical morphology agrees well with that of the Oh et al. (2008) model, their Fig. 1, at t = 0.1 and 0.2 Gyr. While the uncertainties for each of these time-scales are large and difficult to quantify, taken together they indicate that the interaction probably occurred within the last ~1.0–2.5 × 10⁸ yr. The presence of a prominent tidal tail in this time frame indicates that the Oh et al. (2008) models apply to the interaction and implies an interaction with S< 0.3.
The ~1.0–2.5 × 10⁸ yr interaction time-scale indicates NGC 93 is the most probable perturber of NGC 90 which would rule out interactions with other similar sized SRGb063 galaxy group members (see Fig. 1, right panel) projected at greater distances.
Tidal interactions between pairs of galaxies are known to be capable of displacing substantial fractions of their H i, but it is quite unusual for the highest density H i to be observed beyond the optical disks. Some other examples are NGC 3921 (Hibbard & van Gorkom 1996), Arp 105 (Duc et al. 1997) and Arp 181 (Sengupta et al. 2013).
H i masses for galaxies of a size and morphological type similar to NGC 90 and NGC 93 are expected to be ~1.0 × 10¹⁰ M⊙ and ~4.3 × 10⁹ M⊙ respectively, with an error of ~50%(Haynes & Giovanelli 1984). If we assume that it is only the low velocity H i component (see Sect. 3.1) that remains viralised within the NGG 90 potential, then its H i mass is ~3.4 × 10⁹ M⊙, with a higher than usual uncertainty (≥10%) because this mass is derived from an approximate separation of the NGC 90 spectrum into high- and low-velocity components. These complications together with the uncertainty in the expected H i mass values (Haynes & Giovanelli 1984) prevents us from making a conclusive statement on the H i deficiency of NGC 90, although it is possible that its apparent H i deficiency is real. Based on the marginal detection of H i in NGC 93 from our GMRT map we conclude that NGC 93 has no significant H i content. Again the expected H i mass estimate of NGC 93 is also highly uncertain as its morphological type is not clearly known (Table 1). But marginal GMRT detection of H i in NGC 93 strengthens the case for it being H i deficient.
4.2. Possible explanations
While it remains unclear whether the Arp 65 pair, individually or together, is H i deficient, we observed a massive H i cloud without detected optical, UV or Spitzer 24 μm counterparts, projected beyond the pair’s optical disks. Additionally, the prominent tidal arms or tails at optical wavelengths are a clear signature of a recent tidal interaction (~1.0–2.5 × 10⁸ yr). We discuss three possible scenarios below which could explain these features and reach a conclusion about which is the most probable scenario.
4.2.1. Intra-group medium and ram pressure
NGC 90 is projected ~3.3 arcmin (70 kpc) east of the intra-group medium (IGM) X-ray emission centroid of the SRGb0063 group mapped by Mahdavi et al. (2000). In their ROSAT map, NGC 90 is projected at the easternmost edge of the 3σ contour. The SRGb0063 group has an LX(0.5) = 3.63 × 1042 erg s-1 (Mahdavi & Geller 2004) and a velocity dispersion of 336 ± 36 km s-1. NGC 90 has a Vopt of 5197 km s-1, which is 574 km s-1 lower than the group Vopt = 5771 ± 48 km s-1 (Mahdavi & Geller 2004).
The strong ram pressure that can arise in galaxy clusters because of their dense intracluster medium and high velocity dispersions is capable of stripping and displacing large quantities of H i. But ram pressure is predicted to be much weaker in galaxy groups. Comparing the LX and velocity dispersion of the SRGb063 group with that of galaxy clusters, we see the SRGb063 LX is about two orders of magnitude lower and the velocity dispersion is a factor of 2 to 3 times lower than for galaxy clusters. We would therefore expect ram pressure in the SRGb063 group to be at least an order of magnitude or two lower than in clusters. While there is evidence that ram-pressure stripping has produced H i deficiencies in galaxy groups with X-ray emitting IGM (e.g. Davis et al. 1997; Sengupta & Balasubramanyam 2006), several studies concur that for galaxies with M ∗ similar to NGC 90 (whether in galaxy groups or galaxy clusters), large offsets of their highest density H i beyond optical disk cannot be attributed to ram pressure alone (Bravo-Alfaro et al. 2000; Chung et al. 2009; Scott et al. 2010). Still, we also note that the extent of the NGC 90 H i disk (assuming it is traced by the low-velocity H i component) is similar to that of its optical disk. Taken in isolation this could suggest ram-pressure stripping, but in this case the recent tidal interaction seems a more likely cause for the truncation of low-velocity H i disk. We conclude that while there may be low-level ram-pressure stripping, it is highly unlikely to be cause of the displacement of the high-density H i gas to the SE of NGC 90.
4.2.2. SE high-velocity H I mass belongs to a dwarf galaxy
An alternative scenario is that the entire SE high-velocity H i mass belongs to a small dwarf galaxy. However a dwarf galaxy with an H i mass of ~3.4 × 10⁹ M⊙ is expected to have a stellar mass of least a few times 108 M⊙ and a surface brightness of ~24–25 mag arcsec-2, which would be visible in the SDSS and UV images. But in this case there is no visible optical or UV counterpart at these wavelengths. Moreover the velocity field of the SE high-velocity H i mass is irregular, more resembling debris than a galaxy.
4.2.3. Gas-rich NGC 90 interacts with gas-poor NGC 93
In this scenario the SE high-velocity H i mass that lies between NGC 90 and NGC 93 in velocity space and offset ~25 kpc in projection SE of the NGC 90 disk (see Fig. 2, bottom left panel) is a result of the tidal interaction between NGC 90 and NGC 93 which also produced the optical interaction signatures in NGC 90. The reason for the marginal GMRT H i detection in NGC 93 is that it was already essentially devoid of H i prior to the interaction, which means almost all of the H i detected with the GMRT belonged to NGC 90 before the interaction. Had NGC 93 contained a significant mass of H i before the interaction, we would expect the bulk of it to have remained bound to NGC 93 because of its deeper potential well compared to NGC 90. In this scenario the pair interaction caused a massive displacement of about half of the H i in NGC 90 (the SE high-velocity H i mass) ~1.0–2.5 × 10⁸ yr ago. This an effect on H i similar to the one that caused the massive H i displacement beyond the optical disks observed in another interacting pair, Arp 181 (Sengupta et al. 2013). But, unlike Arp 181 (M ∗ ratio 1:1.6), in Arp 65 the displacement is primarily in the velocity plane, although with some offset in the plane of the sky. The displaced H i was tidally stripped from NGC 90 during the interaction and accelerated toward the NGC 93 velocity during the closest approach, attracted by the deeper gravitational potential of NGC 93 (see Fig. 2, middle right panel). The ~3.4 × 10⁹ M⊙ H i that is now observed within the NGG 90 optical disk (the low-velocity NGC 90 H i component) rapidly re-virialised in the gravitational potential of the galaxy and now presents as a rotating H i disk. In contrast, despite having a similar H i mass and greater maximum H i column density than the low-velocity NGC 90 component, the SE H i mass remains as evolving H i debris that currently lacks H i rotation and SF signatures. Assuming NGC 93 orbit takes it farther from NGC 90 before their next encounter it seems likely that the near-term fate of the SE H i mass will be to fall back into the NGC 90 potential. While it would take tailored modelling to prove this scenario, it appears to provide the most reasonable explanation amongst the alternatives considered for observations.
4.3. Star formation in the tidal debris
The FUV (GALEX) image of the Arp 65 pair reveals several interaction-induced star-forming zones in the tidal arms and outer disk of NGC 90. At the base of the tidal tail projected north-west of the NGC 90 optical disk, a particularly bright hinge clump was reported by Smith et al. (2010; labelled as SF1 in Fig. 2). This clump shows strong emission in the Spitzer 8 μm image (Smith et al. 2007). In addition, beads of star formation are also visible all along the NGC 90 tail north-west of the hinge clump. There are several star-forming zones to the east and south-east of NGC 90, and several of them are beyond the optical disk (the prominent ones are labelled as SF2, SF3 in Fig. 2, top panel). We derived the stellar masses of these clumps using online Spitzer IRAC 3.6 μm and 4.5 μm photometry data (Smith et al. 2007) and the recipe from Eskew et al. (2012). The hinge clump (SF1) is the most massive star-forming zone with an estimated stellar mass ~4.5 × 10⁸ M⊙. The stellar mass estimates for SF2 and SF3 are 1.5 × 10⁸ M⊙ and 7.2 × 10⁷ M⊙ respectively. Uncertainties for these masses are ~10%. In the Spitzer images SF3 consists of at least two clumps while SF2 has a bright main clump and a diffuse area of star formation around it. The star formation rates (SFR) of each clump were estimated using Spitzer MIPS 24 μm data using the calibration reported by Rieke et al. (2009). As expected, the stellar clump with the highest mass, SF1, shows the highest SFR amongst the three main star-forming zones. The SFRs of SF1, SF2, and SF3 were estimated to be 0.025, 0.003 and 0.007 M⊙ yr-1, respectively.
The H i image of NGC 90 (Fig. 2, top panel) reveals that all three star formation zones are embedded in H i tails and debris. However, the H i column densities at the positions of the SF zones vary between 1.2–4.7 × 1020 cm-2. None of the three SF zones coincide with the local maxima of the H i column density. The highest H i column density in these regions is ~4.7 × 1020 cm-2, where the synthesised beam samples a 16.6 × 13.2 kpc area. The high-resolution H i maps were made using a taper on the u,v data and also yielded similar results. The bottom right panel of Fig. 2 shows the last three highest column density contours (in black), between 1.5–8.3 × 1020 cm-2, overlaid on the low-resolution H i contours (in white) and the SDSS optical image of NGC 90. Only the high column density contours are plotted to highlight the H i local maxima. Here the synthesised beam samples an area of 8.0 × 5.2 kpc. The distribution appears to be more clumpy and fragmented than its low-resolution counterpart, however none of the H i clumps coincide with the known star-forming zones. While there is no consensus in the literature about the threshold H i column density at which star clusters form in tidal debris and outer disk regions, Maybhate et al. (2007) found an increase in the number of star clusters above N(H i) ~ 4 × 1020 cm-2. They suggested that a H i column density threshold may be a necessary but not a sufficient condition for star cluster formation. An important point to be noted here is that the synthesised beam size plays a crucial role and the largest spatial scale sampled in Maybhate et al. (2007) was 7.5 kpc. Our high- and low-resolution GMRT maps sample between 7 kpc to 16 kpc respectively. Considering this, we find that in NGC 90, most of the star-forming zones more or less satisfy the threshold of Maybhate et al. (2007). Moreover, as suggested in Maybhate et al. (2007), in Arp 65 we also find that this threshold is indeed not a sufficient criterion for star formation. The highest column density H i in Arp 65 (~8.0 × 1020 cm-2, in our high-resolution maps) was detected within SE high-velocity H i mass.
A star formation map of NGC 90 (Fig. 4) was created by co-adding Spitzer 24 μm and GALEX images in units of M⊙ yr-1 pix-1 where the size of each pixel is 2.4′′. We used sky-background-subtracted archive image and converted the observed flux to SFR using the calibrations provided by Rieke et al. (2009) and Kennicutt (1998) for 24 μm and FUV emission, respectively. The figure shows no sign of any star-forming activity above the sky-noise limit within a radius of 20′′ (~7 kpc) of the highest H i column density of the SE high-velocity H i mass. Sky background subtraction for the Spitzer 24 μm image was difficult. The archival Spitzer 24 μm images are not cleaned properly and the background due to CCD reflection is severe. The observed typical rms across the map is ~2 × 10⁻⁵ M⊙ yr-1 per pixel and can be considered as a reasonable upper limit. Using this, the integrated upper limit SFR within a 20′′ radius of the H i column density maximum in the SE high-velocity H i mass is 2.2 M⊙ yr-1. No evidence of star formation associated with this high H i column density was found in the SDSS, Spitzer, or GALEX data.
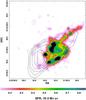 |
Fig. 4 Spitzer 24 μm + GALEX FUV star formation map of NGC 90. Low-resolution integrated H i intensity contours (same as Fig. 2) are also plotted on the star formation map. |
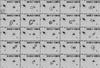 |
Fig. 5 H i channel images for the Arp 65 pair. The contour levels plotted are 1.2 mJy (3, 4, 5). The beam (48.32′′ × 38.29′′) is shown in the bottom left corner of the topmost channel image. |
5. Concluding remarks
We have mapped the H i in Arp 65 (NGC 90 and NGC 93) with the GMRT and found that approximately half of the detected H i is in a high-velocity component projected SE of the NGC 90 optical disk, which was probably removed from NGC 90 during the interaction ~1.0–2.5 × 10⁸ yr ago with its more massive gas-poor partner NGC 93. The balance of the H i is detected in a disk rotating at a lower velocity that is associated with NGC 90. The high-velocity H i component contains the H i column density maxima ~1.2 arcmin (25 kpc) E of the NGC 90 optical centre. The tidal interaction that produced the impressive optical tidal tails in NGC 90 was probably also responsible for removal of H i from the NGC 90 disk. This means that the asymmetric H i morphology of NGC 90 disk is the result of the superposition of gas removed from NGC 90 during its tidal interaction with NGC 93 on the remaining NGC 90 H i disk. Our observations of Arp 65 and Arp 181 indicate that high-impact pre-merger tidal interactions involving large spirals, with M ∗ ratios in the range ~1:1.6 to 1:3, have the ability to displace large factions of the H i beyond the optical disks of the participants. Arp 65 belongs to a small number of galaxy pairs where the highest density H i is observed beyond the optical disks of the pair following an interaction (e.g. Hibbard & van Gorkom 1996; Sengupta et al. 2013). We found that NGC 90 has extended on-going star formation in the outer optical disk, most likely triggered by interaction. In the three main star-forming clumps in the tidal debris and arm, we found that the star formation is occurring in regions with H i column densities ~4.7 × 1020 cm-2 or lower. But in contrast to Arp 181, which contains a star-forming tidal dwarf candidate, no signature of star formation was found near the highest column density H i located in the high-velocity H i debris south-east of the NGC 90 optical disk. This debris hosts no star formation signatures and reaffirms that high H i column densities are a necessary, but not sufficient criterion for star formation.
N(H i) = (1.1 × 10²¹/a × b) × ∫Sνdv; where N(H i) is the H i column density, a and b are the beam major and minor axes, Sν is the flux per channel and dv is the per channel velocity width. The integral is over all the channels with line emission (Fig. 1, top panel).
Trot [Gyr] = 6.1478 r/Vrot, where r = the optical radius [kpc] and Vrot = 0.5ΔV [km s-1]/sin(i).
Based on PA = 113.4° and inclination = 34.5° from HyperLeda.
60°/360° × 0.7 × 10⁹ yr = 1.2 × 10⁸ yr.
Acknowledgments
We are grateful to the anonymous referee for the helpful remarks that have significantly improved the paper. T.S. acknowledges support for this project from the Fundação para a Ciência e a Tecnologia (FCT) grant No. SFRH/BPD/103385/2014. We thank the staff of the GMRT who have made these observations possible. GMRT is run by the National Centre for Radio Astrophysics of the Tata Institute of Fundamental Research. The Nasa Extragalactic Database, NED, is operated by the Jet Propulsion Laboratory, California Institute of Technology, under contract with the National Aeronautics and Space Administration. We acknowledge the usage of the HyperLeda database (http://leda.univ-lyon1.fr). Funding for the SDSS and SDSS-II has been provided by the Alfred P. Sloan Foundation, the Participating Institutions, the National Science Foundation, the US Department of Energy, the National Aeronautics and Space Administration, the Japanese Monbukagakusho, the Max Planck Society, and the Higher Education Funding Council for England. The SDSS Web Site is http://www.sdss.org/. The SDSS is managed by the Astrophysical Research Consortium for the Participating Institutions. The Participating 13 Institutions are the American Museum of Natural History, Astrophysical Institute Potsdam, University of Basel, University of Cambridge, Case Western Reserve University, University of Chicago, Drexel University, Fermilab, the Institute for Advanced Study, the Japan Participation Group, Johns Hopkins University, the Joint Institute for Nuclear Astrophysics, the Kavli Institute for Particle Astrophysics and Cosmology, the Korean Scientist Group, the Chinese Academy of Sciences (LAMOST), Los Alamos National Laboratory, the Max-Planck-Institute for Astronomy (MPIA), the Max-Planck-Institute for Astrophysics (MPA), New Mexico State University, Ohio State University, University of Pittsburgh, University of Portsmouth, Princeton University, the United States Naval Observatory, and the University of Washington.
References
- Baars, J. W. M., Genzel, R., Pauliny-Toth, I. I. K., & Witzel, A. 1977, A&A, 61, 99 [NASA ADS] [Google Scholar]
- Barnes, J. E. 1992, ApJ, 393, 484 [NASA ADS] [CrossRef] [Google Scholar]
- Bell, E. F., McIntosh, D. H., Katz, N., & Weinberg, M. D. 2003, ApJS, 149, 289 [NASA ADS] [CrossRef] [Google Scholar]
- Blanton, M. R., Hogg, D. W., Bahcall, N. A., et al. 2003, ApJ, 592, 819 [NASA ADS] [CrossRef] [Google Scholar]
- Bravo-Alfaro, H., Cayatte, V., van Gorkom, J. H., & Balkowski, C. 2000, AJ, 119, 580 [NASA ADS] [CrossRef] [Google Scholar]
- Casteels, K. R. V., Bamford, S. P., Skibba, R. A., et al. 2013, MNRAS, 429, 1051 [NASA ADS] [CrossRef] [Google Scholar]
- Chien, L.-H., Barnes, J. E., Kewley, L. J., & Chambers, K. C. 2007, ApJ, 660, L105 [Google Scholar]
- Chung, A., van Gorkom, J. H., Kenney, J. D. P., Crowl, H., & Vollmer, B. 2009, AJ, 138, 1741 [NASA ADS] [CrossRef] [Google Scholar]
- Davis, D. S., Keel, W. C., Mulchaey, J. S., & Henning, P. A. 1997, AJ, 114, 613 [NASA ADS] [CrossRef] [Google Scholar]
- Duc, P.-A., Brinks, E., Wink, J. E., & Mirabel, I. F. 1997, A&A, 326, 537 [NASA ADS] [Google Scholar]
- Eskew, M., Zaritsky, D., & Meidt, S. 2012, AJ, 143, 139 [NASA ADS] [CrossRef] [Google Scholar]
- Haynes, M. P., & Giovanelli, R. 1984, AJ, 89, 758 [NASA ADS] [CrossRef] [Google Scholar]
- Hibbard, J. E., & van Gorkom, J. H. 1996, AJ, 111, 655 [NASA ADS] [CrossRef] [Google Scholar]
- Holwerda, B. W., Pirzkal, N., Cox, T. J., et al. 2011, MNRAS, 416, 2426 [NASA ADS] [CrossRef] [Google Scholar]
- Kennicutt, Jr., R. C. 1998, ARA&A, 36, 189 [Google Scholar]
- Mahdavi, A., & Geller, M. J. 2004, ApJ, 607, 202 [NASA ADS] [CrossRef] [Google Scholar]
- Mahdavi, A., Böhringer, H., Geller, M. J., & Ramella, M. 2000, ApJ, 534, 114 [NASA ADS] [CrossRef] [Google Scholar]
- Maybhate, A., Masiero, J., Hibbard, J. E., et al. 2007, MNRAS, 381, 59 [NASA ADS] [CrossRef] [Google Scholar]
- Mihos, J. C. 2001, ApJ, 550, 94 [NASA ADS] [CrossRef] [Google Scholar]
- Oh, S. H., Kim, W.-T., Lee, H. M., & Kim, J. 2008, ApJ, 683, 94 [NASA ADS] [CrossRef] [Google Scholar]
- Rieke, G. H., Alonso-Herrero, A., Weiner, B. J., et al. 2009, ApJ, 692, 556 [NASA ADS] [CrossRef] [Google Scholar]
- Scott, T. C., Bravo-Alfaro, H., Brinks, E., et al. 2010, MNRAS, 403, 1175 [NASA ADS] [CrossRef] [Google Scholar]
- Sengupta, C., & Balasubramanyam, R. 2006, MNRAS, 369, 360 [NASA ADS] [CrossRef] [Google Scholar]
- Sengupta, C., Saikia, D. J., & Dwarakanath, K. S. 2012, MNRAS, 420, 2 [NASA ADS] [CrossRef] [Google Scholar]
- Sengupta, C., Dwarakanath, K. S., Saikia, D. J., & Scott, T. C. 2013, MNRAS, 431, L1 [NASA ADS] [CrossRef] [Google Scholar]
- Sengupta, C., Scott, T. C., Dwarakanath, K. S., Saikia, D. J., & Sohn, B. W. 2014, MNRAS, 444, 558 [NASA ADS] [CrossRef] [Google Scholar]
- Smith, B. J., Struck, C., Hancock, M., et al. 2007, AJ, 133, 791 [NASA ADS] [CrossRef] [Google Scholar]
- Smith, B. J., Giroux, M. L., Struck, C., & Hancock, M. 2010, AJ, 139, 1212 [NASA ADS] [CrossRef] [Google Scholar]
- Springob, C. M., Haynes, M. P., Giovanelli, R., & Kent, B. R. 2005, ApJS, 160, 149 [Google Scholar]
- Struck, C., Kaufman, M., Brinks, E., et al. 2005, MNRAS, 364, 69 [NASA ADS] [CrossRef] [Google Scholar]
- Torres-Flores, S., Epinat, B., Amram, P., Plana, H., & Mendes de Oliveira, C. 2011, MNRAS, 416, 1936 [NASA ADS] [CrossRef] [Google Scholar]
- Wielen, R. 1990, Dynamics and Interactions of Galaxies (Springer-Verlag) [Google Scholar]
All Tables
All Figures
|
Fig. 1 Left: Arp 65 pair: SDSS g, r, i-band false-colour image. The galaxy at the centre of the image is NGC 90 and the galaxy of similar size at the eastern edge of the image is NGC 93. Right: SRGb063 group: SDSS r-band image of the Arp 65 pair in the SRGb063 group. The blue and the red crosses are NGC 90 and NGC 93 respectively. Crosses with other colours represent nearby massive group members: CGCG 479-012 (green), NGC 85B (yellow), NGC 80 (orange). The black X marks the X-ray centroid of SRGb063 group from Mahdavi et al. (2000). |
| In the text | |
|
Fig. 2 Arp 65. Top: integrated H i intensity contours (white) on SDSS r-band image. The blue contours are FUV from GALEX. The H i column density levels are 1020 cm-2× (0.6, 1.2, 1.8, 2.9, 4.7, 5.9, 7.2). Middle left: the H i velocity field for NGC 90, in colour. The black contour shows the GALEX FUV extent NGC 90. The red contour is the H i 0.6 × 1020 cm-2 contour from the top panel. Middle right: H i spectra for NGC 90: GMRT (black) and single dish (blue) from Springob et al. (2005). NGC 93: single dish spectrum (red) Springob et al. (2005) spectrum for NGC 93. The optical velocities of NGC 90 and NGC 93 are marked with dashed lines. Bottom left: velocity field of the low-velocity component, overlaid with of the total intensity contours of the high-velocity component (blue) and FUV contours (black) define the edge of the galaxy. Bottom right: high-resolution H i intensity contours (black) overlaid on low-resolution H i intensity contours (white) and SDSS r-band image. The low-resolution contours are same as the top panel. The high-resolution contours are 1020 cm-2 × (1.5,4.6,8.3). For each of the maps the beam size is shown by a black ellipse at bottom of each map. |
| In the text | |
|
Fig. 3 Position-velocity (PV) diagram of the H i mass detected with NGC 90. Both the regular disk of NGC 90 and the SE high-velocity H i mass (within the black ellipse) are visible in the PV diagram. |
| In the text | |
|
Fig. 4 Spitzer 24 μm + GALEX FUV star formation map of NGC 90. Low-resolution integrated H i intensity contours (same as Fig. 2) are also plotted on the star formation map. |
| In the text | |
|
Fig. 5 H i channel images for the Arp 65 pair. The contour levels plotted are 1.2 mJy (3, 4, 5). The beam (48.32′′ × 38.29′′) is shown in the bottom left corner of the topmost channel image. |
| In the text | |
Current usage metrics show cumulative count of Article Views (full-text article views including HTML views, PDF and ePub downloads, according to the available data) and Abstracts Views on Vision4Press platform.
Data correspond to usage on the plateform after 2015. The current usage metrics is available 48-96 hours after online publication and is updated daily on week days.
Initial download of the metrics may take a while.