Fig. 2
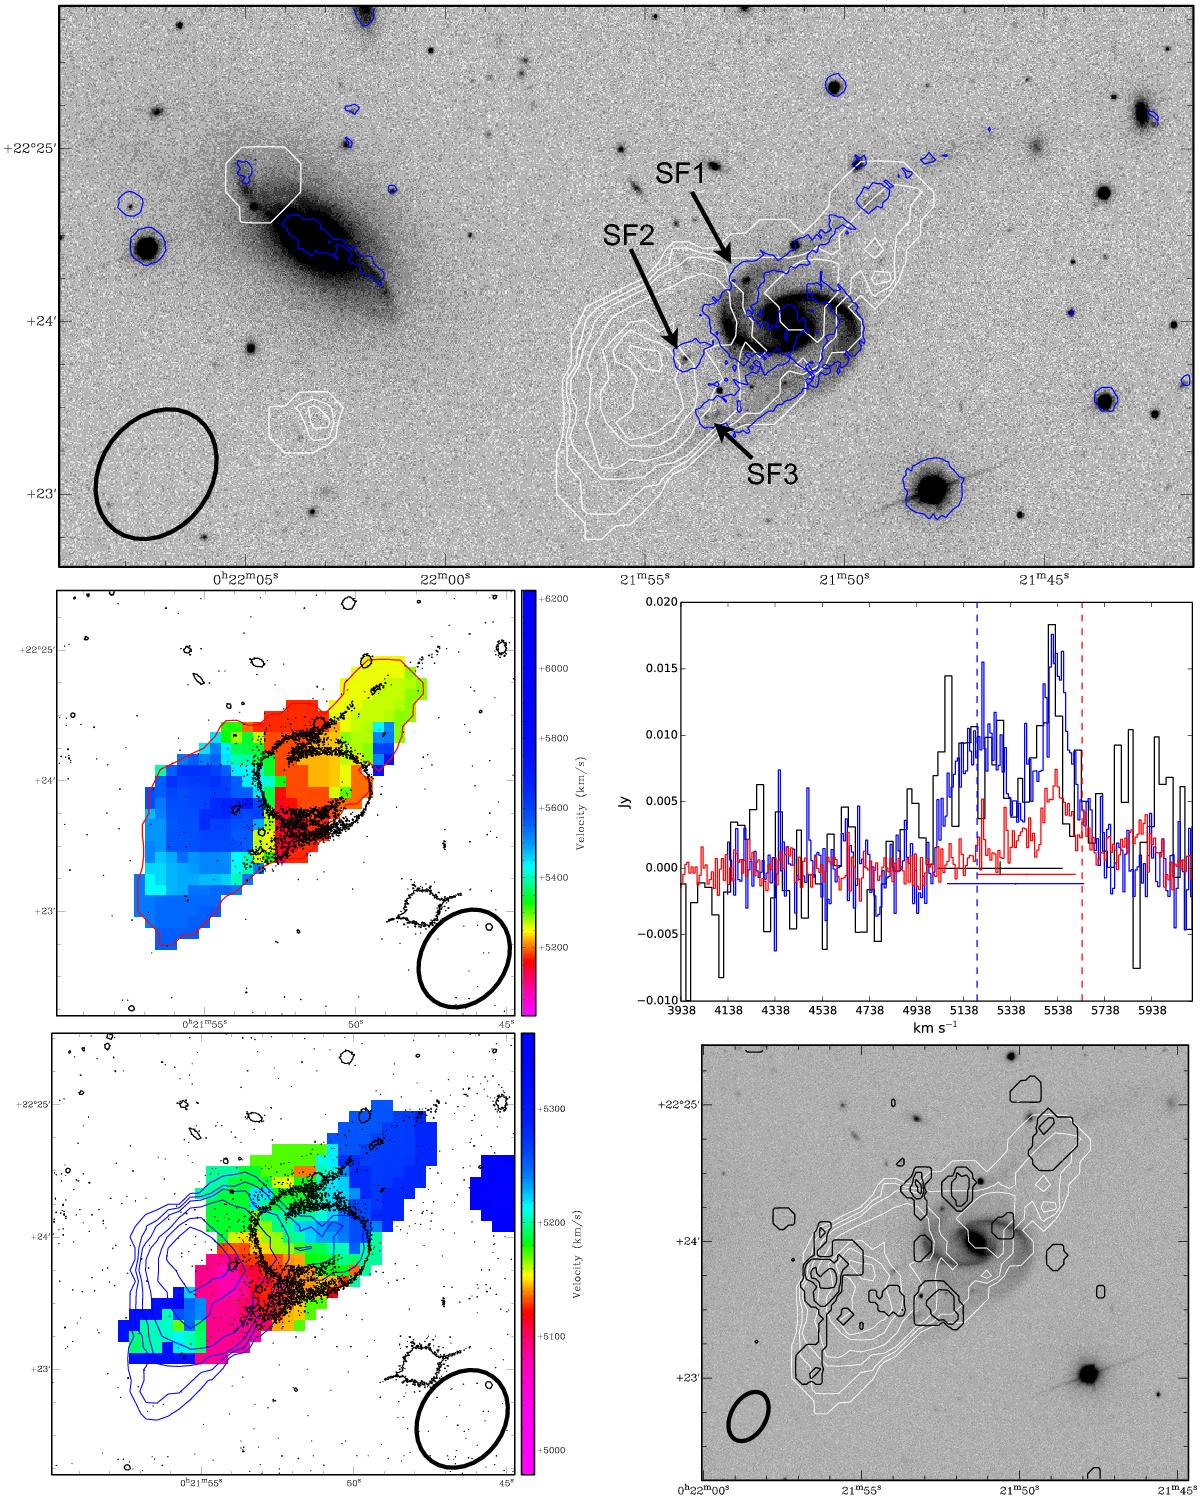
Arp 65. Top: integrated H i intensity contours (white) on SDSS r-band image. The blue contours are FUV from GALEX. The H i column density levels are 1020 cm-2× (0.6, 1.2, 1.8, 2.9, 4.7, 5.9, 7.2). Middle left: the H i velocity field for NGC 90, in colour. The black contour shows the GALEX FUV extent NGC 90. The red contour is the H i 0.6 × 1020 cm-2 contour from the top panel. Middle right: H i spectra for NGC 90: GMRT (black) and single dish (blue) from Springob et al. (2005). NGC 93: single dish spectrum (red) Springob et al. (2005) spectrum for NGC 93. The optical velocities of NGC 90 and NGC 93 are marked with dashed lines. Bottom left: velocity field of the low-velocity component, overlaid with of the total intensity contours of the high-velocity component (blue) and FUV contours (black) define the edge of the galaxy. Bottom right: high-resolution H i intensity contours (black) overlaid on low-resolution H i intensity contours (white) and SDSS r-band image. The low-resolution contours are same as the top panel. The high-resolution contours are 1020 cm-2 × (1.5,4.6,8.3). For each of the maps the beam size is shown by a black ellipse at bottom of each map.
Current usage metrics show cumulative count of Article Views (full-text article views including HTML views, PDF and ePub downloads, according to the available data) and Abstracts Views on Vision4Press platform.
Data correspond to usage on the plateform after 2015. The current usage metrics is available 48-96 hours after online publication and is updated daily on week days.
Initial download of the metrics may take a while.