Fig. 6
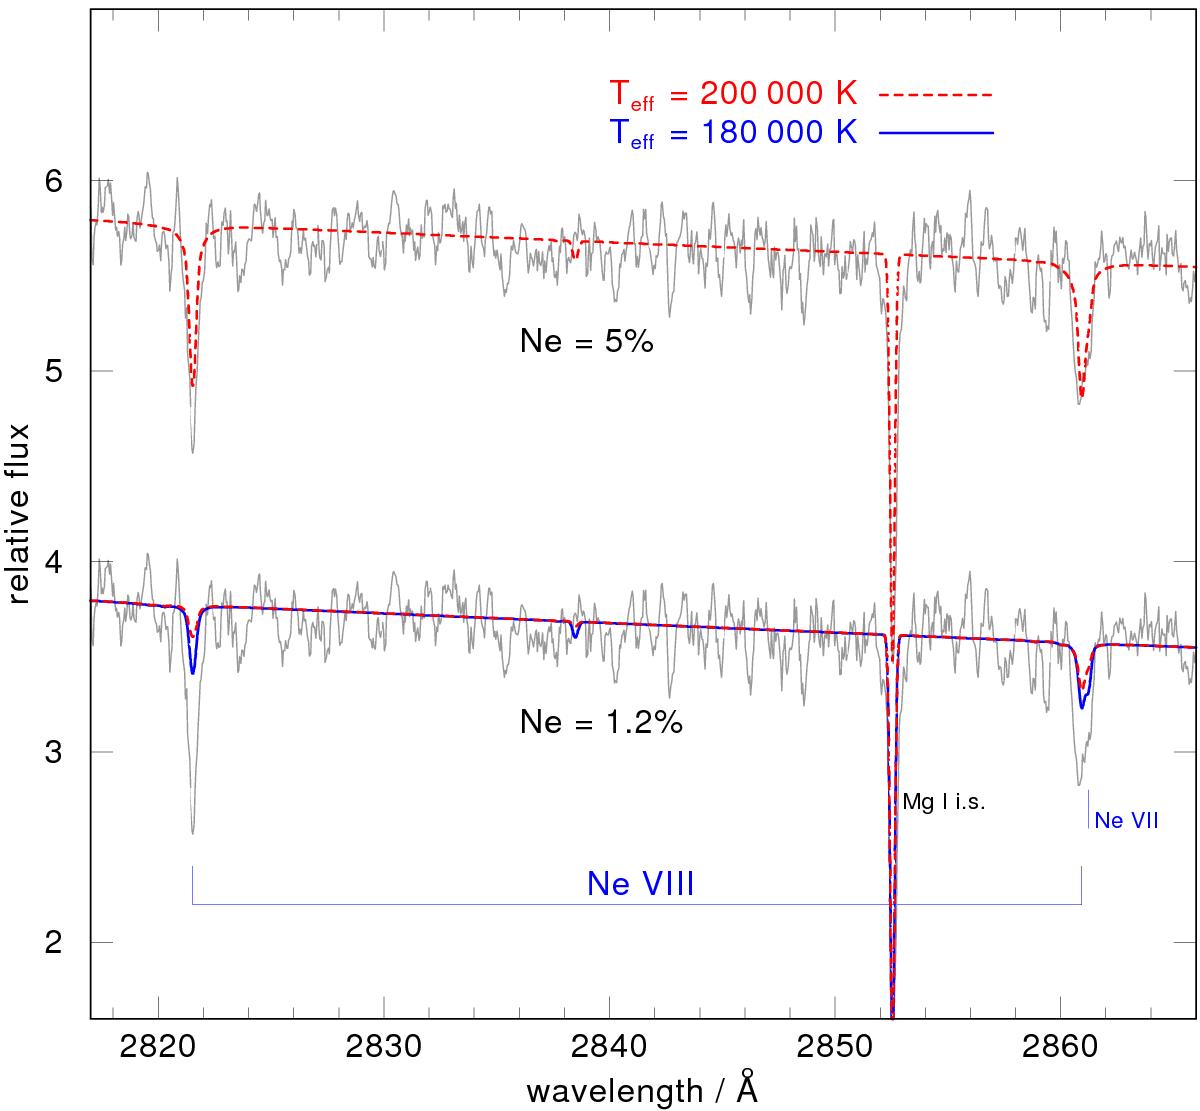
Detail of the NUV spectrum (thin gray lines) showing the Ne viii 3s−3p doublet. Bottom: overplotted are two models (thick lines) with different temperatures (dashed and solid lines as indicated in the legend) and Ne = 1.2%. Top: same spectrum and a model with Ne = 5% (thick dashed line). Models have log g= 6.7. Observation and models were convolved with a 0.18 Å boxcar and 0.20 Å Gaussians, respectively.
Current usage metrics show cumulative count of Article Views (full-text article views including HTML views, PDF and ePub downloads, according to the available data) and Abstracts Views on Vision4Press platform.
Data correspond to usage on the plateform after 2015. The current usage metrics is available 48-96 hours after online publication and is updated daily on week days.
Initial download of the metrics may take a while.