Fig. B.1
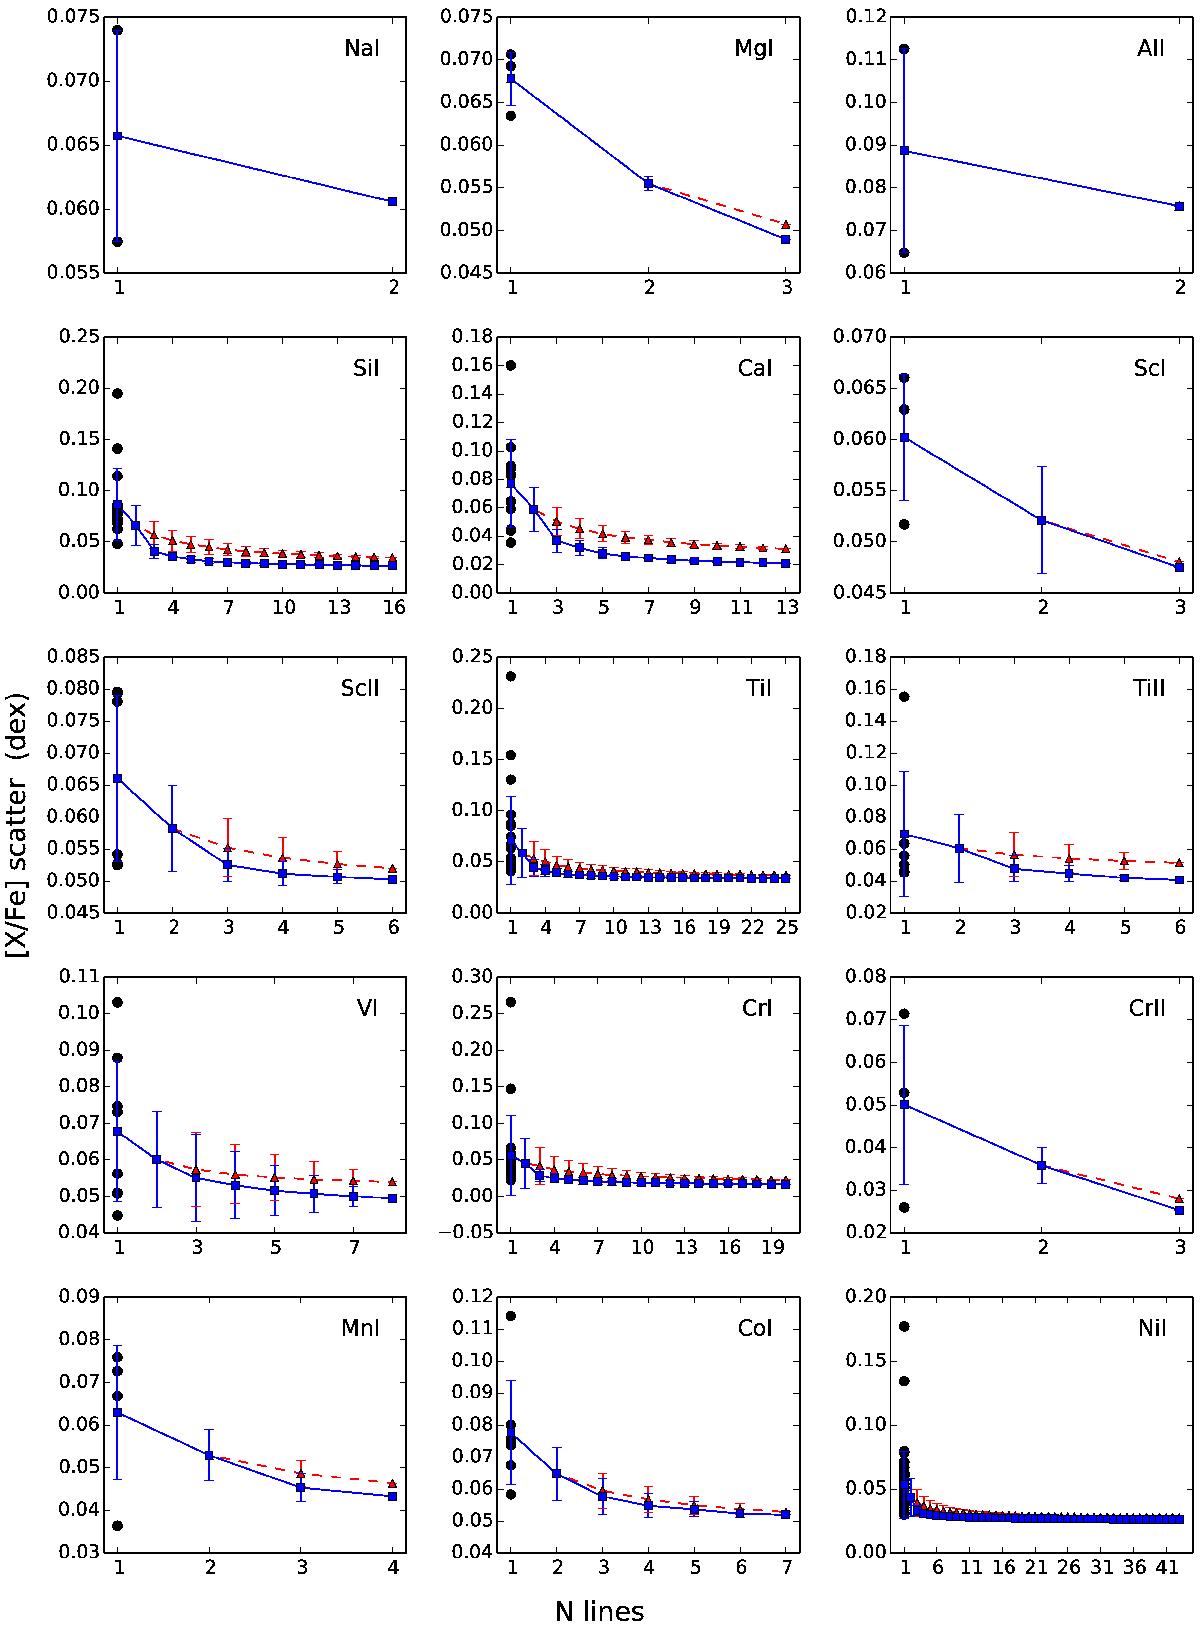
Dependence of [X/Fe] star-to-star scatter for solar analogs with [Fe/H] = 0.0 ± 0.10 dex on the number of lines. Red triangles show the scatter when the individual abundances are calculated as an AM and the blue squares indicate the scatter in [X/Fe] when the WM method was used for the abundance derivation. The black dots show the [X/Fe] scatter for each individual line that was used to derive [X/H]. The error bars indicate the dispersion of possible combinations of the lines.
Current usage metrics show cumulative count of Article Views (full-text article views including HTML views, PDF and ePub downloads, according to the available data) and Abstracts Views on Vision4Press platform.
Data correspond to usage on the plateform after 2015. The current usage metrics is available 48-96 hours after online publication and is updated daily on week days.
Initial download of the metrics may take a while.