| Issue |
A&A
Volume 583, November 2015
|
|
|---|---|---|
| Article Number | A113 | |
| Number of page(s) | 4 | |
| Section | Astrophysical processes | |
| DOI | https://doi.org/10.1051/0004-6361/201527029 | |
| Published online | 04 November 2015 | |
Research Note
Ten years of INTEGRAL observations of the hard X-ray emission from SGR 1900+14
1 Institut für Astronomie und Astrophysik, Eberhard Karls Universität, Sand 1, 72076 Tübingen, Germany
e-mail: This email address is being protected from spambots. You need JavaScript enabled to view it.
2 ISDC Data Center for Astrophysics, Université de Genève, 16 chemin d’Écogia, 1290 Versoix, Switzerland
3 INAF–Istituto di Astrofisica Spaziale e Fisica Cosmica, via E. Bassini 15, 20133 Milano, Italy
4 AIM (UMR 7158 CEA/DSM-CNRS-Université Paris Diderot) Irfu/Service d’Astrophysique, Saclay, 91191 Gif-sur-Yvette Cedex, France
Received: 21 July 2015
Accepted: 4 October 2015
Abstract
We exploited the high sensitivity of the INTEGRAL IBIS/ISGRI instrument to study the persistent hard X-ray emission of the soft gamma-ray repeater SGR 1900+14, based on ~11.6 Ms of archival data. The 22−150 keV INTEGRAL spectrum can be well fitted by a power law with photon index 1.9 ± 0.3 and flux Fx = (1.11 ± 0.17) × 10-11 erg cm-2 s-1 (20−100 keV). A comparison with the 20−100 keV flux measured in 1997 with BeppoSAX, and possibly associated with SGR 1900+14, shows a luminosity decrease by a factor of ~5. The slope of the power law above 20 keV is consistent within the uncertainties with that of SGR 1806−20, the other persistent soft gamma-ray repeater for which a hard X-ray emission extending up to 150 keV has been reported.
Key words: gamma rays: general / pulsars: individual: SGR 1900+14 / pulsars: general
© ESO, 2015
1. Introduction
Soft gamma-ray repeaters (SGRs), together with anomalous X-ray pulsars (AXPs), are high energy sources which are thought to be magnetars, i.e. neutron stars whose emission is powered mainly by their strong magnetic field (see Mereghetti et al. 2015 for a recent review).
Soft gamma-ray repeaters show recurrent short bursts (typical duration of the order of ≈0.1 s) in the X-ray and soft gamma-ray range, with peak luminosities of 1039−1042 erg s-1 for normal bursts and up to ≈1047 erg s-1 for giant flares. Bursts are usually emitted during active states that can last from a few days to months. Active states are interrupted by long quiescent (or non-bursting) time intervals with persistent luminosities of ≈1033−1036 erg s-1.
In this paper we make use of the archival data of the INTErnational Gamma-Ray Astrophysics Laboratory (INTEGRAL, Winkler et al. 2003) collected in the period 2003–2013 to study the hard X-ray emission (above 20 keV) from SGR 1900+14.
Since the launch of INTEGRAL, SGR 1900+14 has shown only two periods of bursting activity: November 2002 (Hurley et al. 2002) and March 2006 (Vetere et al. 2006; Golenetskii et al. 2006). Its persistent emission has been extensively studied, especially in the soft X-ray range (≲10 keV) with XMM-Newton (e.g. Mereghetti et al. 2006), Chandra (e.g. Göǧüş et al. 2011), Suzaku (Nakagawa et al. 2009), and BeppoSAX (Tiengo et al. 2007; Esposito et al. 2007). The XMM-Newton and Suzaku spectra (0.8−10 keV) are well fitted either by an absorbed (NH ≈ 2.1 × 1022 cm-2) power law (Γ ≈ 1.9 for XMM-Newton, Γ ≈ 2.8 for Suzaku) plus a black-body component (kT ≈ 0.5 keV) or by two absorbed black bodies (kT1 ≈ 0.5 keV, kT2 ≈ 1.9 keV; Mereghetti et al. 2006; Nakagawa et al. 2009). Persistent hard X-ray emission from SGR 1900+14 in the 20−100 keV has been discovered by Götz et al. (2006) using observations obtained with INTEGRAL in the period 2003–2004. The hard X-ray emission detected with INTEGRAL was fitted by a power law with photon index Γ ~ 3.1, significantly steeper than that of other SGRs and AXPs (Götz et al. 2006). Esposito et al. (2007) reported the detection of hard (20−150 keV) X-ray emission from a region around SGR 1900+14 with the non-imaging spectrometer Phoswich Detection System (PDS, Frontera et al. 1997) on board the BeppoSAX satellite. They modelled the observed X-ray emission with a power law with slope Γ ≈ 1.6. Three transient X-ray sources were located within the PDS field of view, but none of them was in a bright state during the observation of SGR 1900+14. Therefore, the X-ray emission detected by BeppoSAX was likely produced by SGR 1900+14, although the contamination from other unknown transient sources within the PDS field of view cannot be ruled out (Esposito et al. 2007).
The hard X-ray emission of SGR 1900+14 has been studied so far with a limited set of data. In this work, we exploit ~10 yr of archival INTEGRAL data to further investigate the properties of its emission above 20 keV, and put them in the broader context of the class of magnetars. In Sect. 2 we present the INTEGRAL observations on which our work is based, the data analysis procedure, and the results, which are discussed in Sect. 3.
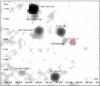 |
Fig. 1 IBIS/ISGRI mosaic image (in cts s-1) of the SGR 1900+14 field in the 22−50 keV band. |
2. Data analysis and results
We used data obtained with the INTEGRAL Soft Gamma-Ray Imager (ISGRI, Lebrun et al. 2003) detector of the coded-mask telescope IBIS (Imager on board INTEGRAL Satellite, Ubertini et al. 2003). ISGRI operates in the ~15–400 keV band. IBIS has a fully coded field of view of 9° × 9° and a partially coded field of view of 29° × 29°.
We performed the reduction and analysis of IBIS/ISGRI data using the Off-line Science Analysis (OSA) 10.1 software provided by the ISDC Data Centre for Astrophysics (Goldwurm et al. 2003; Courvoisier et al. 2003). We analysed all the public data between March 2003 and June 2013 where SGR 1900+14 was within 12° from the centre of the IBIS/ISGRI field of view. At larger off-axis angle the IBIS response is not well known1. We excluded all the data taken during bad time intervals. The resulting data set consists of 4706 pointings, corresponding to an exposure time of ~11.6 Ms.
Sky images of each pointing were generated in the energy band 22−50 keV. SGR 1900+14 was never detected in the individual images because it was below the 5σ threshold of detection.
We combined the individual images of the whole data set to produce the total (mosaic) image (see Fig. 1) in which SGR 1900+14 is detected with a significance of 9.3σ. The pixel significance distribution of a sky image obtained from the convolution of the detector image2 with a decoding array is expected to be Gaussian with zero mean and unitary standard deviation. Systematic errors that are not taken into account by the algorithm that reconstructs the sky image can lead to a broadening of this distribution (Fenimore & Cannon 1978). Systematic effects in the reconstructed image can be originated by the imperfect knowledge of the real instrument and can particularly affect observations of crowded regions of the Galaxy (e.g. Krivonos et al. 2010). We fitted the pixel significance distribution with a Gaussian with standard deviation of 1.18. Therefore, the significance of detection is reduced to 9.3σ/ 1.18 ≈ 7.9σ (for further details, see e.g. Bélanger et al. 2006; Li et al. 2011).
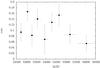 |
Fig. 2 22−50 keV IBIS/ISGRI lightcurve of SGR 1900+14. Time intervals and rates are given in Table 1. |
2.1. Lightcurve analysis
We produced a lightcurve of SGR 1900+14 (Fig. 2) extracting the fluxes from nine mosaic images corresponding to the time intervals indicated in Table 1. Fitting these points with a constant, we obtain a reduced χ2 = 1.48 (8 d.o.f.). Since this value has a large probability (~16%) of being obtained by a constant source, we conclude that there is no evidence for variability in the INTEGRAL data. Note, however, that the large error bars of the measured hard X-ray count rates do not allow us to reveal relatively small flux variations, such as those measured for SGR 1900+14 at lower energy. In fact, variations of ~26% in the soft X-ray flux (0.8−6.5 keV) were detected with XMM-Newton and Chandra during the period ~52 700–54 520 MJD that overlaps that of the INTEGRAL observations analysed in this work (Göǧüş et al. 2011). Following Primini et al. (1993), we estimate that our observations could reveal at a 3σ confidence level only flux variation larger than ~130%.
2.2. Spectral analysis
We extracted the average spectrum of SGR 1900+14 using the source count rates obtained from the mosaic images in five energy bands (22−30, 30−38, 38−50, 50−70, 70−150 keV) using the OSA tool mosaic_spec, which is particularly suited for faint sources. We used the exposure-weighted average ancillary response file and the rebinned response matrix specifically generated for our particular data set. Before fitting, we added systematic uncertainties of 5% to the data set. We obtained a good fit ( , 3 d.o.f.) with a power-law (Γ = 1.9 ± 0.3; uncertainties are at 90% c.l.) and 20−100 keV flux Fx = (1.11 ± 0.17) × 10-11 erg cm-2 s-1.
Figure 3 shows the joint XMM-Newton, IBIS/ISGRI spectrum. We used the IBIS/ISGRI average spectrum obtained from the whole data set and the XMM-Newton data obtained on 2005 September 20 when the source was in quiescent state (Mereghetti et al. 2006). The analysis of EPIC-pn data was performed with the XMM-Newton Science analysis system (SAS) software, version 14.0.0. We rejected time intervals affected by high background, obtaining a total good exposure time of ≈20 ks. We included constant factors in the spectral fitting to allow for normalization uncertainties between the instruments and differences between the soft and hard X-ray spectra due to source variability and not simultaneous observations. We obtained an acceptable fit ( ; 116 d.o.f.) of the joint XMM-Newton, IBIS/ISGRI spectrum with an absorbed (NH = 2.5 ± 0.2 × 1022 cm-2) blackbody (kT = 0.41 ± 0.04 keV) plus a power-law component (Γ = 1.87 ± 0.17). These parameters are consistent with those derived by Mereghetti et al. (2006) from the XMM-Newton data alone.
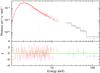 |
Fig. 3 Joint XMM-Newton (red), IBIS/ISGRI (black) spectrum fitted with an absorbed power law plus a blackbody model, with residuals in units of standard deviations. |
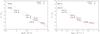 |
Fig. 4 Spectral turnover Γs−Γh as function of the magnetic field B (left panel) and spin-down |
3. Discussion
We analysed 11.6 Ms of INTEGRAL data of SGR 1900+14, obtained from March 2003 to June 2013. We found that the 22−150 keV spectrum is well fitted by a power law with Γ = 1.9 ± 0.3 and flux (1.11 ± 0.17) × 10-11 erg cm-2 s-1. A good agreement is found between the IBIS/ISGRI power-law photon-index and the soft value, measured below ~10 keV with XMM-Newton during a quiescent state in 2005 (Mereghetti et al. 2006). The photon-index and significance of SGR 1900+14 presented here are significantly different from those obtained by Götz et al. (2006; Γ = 3.1 ± 0.5, significance of 9σ) which were based on INTEGRAL data collected in the period March 2003–June 2004 (corresponding to Obs. number 1 of Table 1) and analysed with OSA 5.1. A comparison between the images obtained with OSA 10.1 and OSA 5.1 suggests that the discrepancy in the results might be caused by the substantial improvement in the software that reconstructs the images of the sky from the shadowgram projected by the coded mask onto the detector plane. The images processed with OSA 5.1 showed spurious features, due to residual un-subtracted coding noise, caused by the brightest source in the field of view, GRS 1915+105, which contaminated the spectrum of SGR 1900+14. Such features are no longer present in the images reconstructed with OSA 10.1. Therefore, the spectral results reported here supersede those of Götz et al. (2006).
The slope of the hard X-ray spectrum derived with INTEGRAL is consistent with that measured with BeppoSAX before the giant flare of 1998, but the 20−100 keV luminosity (≈3 × 1035 erg s-1 for d = 15 kpc, Vrba et al. 2000) is smaller by a factor of ~5. A similar decrease in the flux has been observed in the soft band, below ~10 keV (Mereghetti et al. 2006; Göǧüş et al. 2011).
Kaspi & Boydstun (2010) noted an anti-correlation of the spectral turnover Γs−Γh (where Γs is the photon-index in the soft band, ≲10 keV, and Γh is the photon-index in the hard band, ≳10 keV) with inferred magnetic field B and spin-down  . These authors gave a qualitative interpretation for the anti-correlation Γs−Γh vs. B in the framework of models in which the X-ray emission of magnetars strongly depends on magnetospheric currents. For magnetars with higher B, Γs is harder because the scattering optical depth between the relativistic electrons and the surface thermal photons increases. This in turn has an effect on the population of electrons that do not scatter and instead impact on the surface, heating it and creating a corona: fewer electrons will impact on the surface, resulting in a softer Γh.
Figure 4 shows an updated version of the plots Γs−Γh vs. B and . In addition to the magnetars considered by Kaspi & Boydstun (2010) and Vogel et al. (2014; 1E 2259+568, 4U 0142+61, 1RXS 1708−40, SGR 1900+14, 1E 1841−045, and SGR 1806−20), we included our new result for SGR 1900+14 and the pulsed flux of 1E 2259+568 from Vogel et al. (2014). To quantify the significance of the anticorrelation, we determined the Pearson’s linear coefficient r and the null hypothesis probability p. For the total flux data, we found r = −0.97, p = 0.0012 and r = −0.96, p = 0.0025, for Γs−Γh as function of B and , respectively. For the pulsed data, we found r = −0.98, p = 0.0157 and r = −0.98, p = 0.0236 for Γs−Γh as function of B and , respectively. The new value of the spectral turnovers of SGR 1900+14 (0.06 ± 0.23 compared to the previous value −1.2 ± 0.5) and 1E 2259+568 (Vogel et al. 2014) improve the significance of the anticorrelation measured by Kaspi & Boydstun (2010). We used a linear model to fit the data (Γs−Γh = a + blog 10x, where x = B or  ). For Γs−Γh as function of B and total flux data set we found a = 46 ± 2, b = −3.04 ± 0.14, χ2 = 15.9 (4 d.o.f.). For the pulsed flux we obtained a = 53 ± 3, b = −3.5 ± 0.2, χ2 = 9.2 (2 d.o.f.). When considering Γs−Γh as function of , for total flux we found a = −17.4 ± 0.9, b = −1.51 ± 0.07, χ2 = 29.9 (4 d.o.f.); for the pulsed flux: a = −29 ± 3, b = −2.4 ± 0.2, χ2 = 8.3, (2 d.o.f.). A quadratic model (
 ) fits better the total flux data: a = 65 ± 15, b = 12 ± 2, c = 0.5 ± 0.1, χ2 = 2.1 (3 d.o.f.). Best-fit models are shown in Fig. 4.
4. Conclusions
We have reported on a new analysis of the hard X-ray emission from SGR 1900+14 based on ten years of observations with the IBIS/ISGRI instrument on the INTEGRAL satellite. Thanks to the improved calibrations and analysis software, we obtained results that differ from and supersede those reported earlier for this source and based only on the first two years of data. We measured a 20−100 keV flux of Fx = (1.11 ± 0.17) × 10-11 erg cm-2 s-1, which is lower than that seen in 1997 with BeppoSAX by a factor of ~5. While the previously found photon index at E> 20 keV indicated a power law spectrum significantly softer than those of other SGRs and AXPs, the new value of 1.9 ± 0.3 is similar to those found for the other sources and to that measured at lower energy for SGR 1900+14.
See the INTEGRAL data analysis documentation: http://www.isdc.unige.ch/integral/analysis
The detector image is the shadowgram projected by the coded mask of the telescope on the detector plane.
Acknowledgments
We thank the anonymous referee for constructive comments that helped to improve the paper. This work is partially supported by the Bundesministerium für Wirtschaft und Technologie through the Deutsches Zentrum für Luft und Raumfahrt (grant FKZ 50 OG 1301). This work has been partially supported through financial contribution from the agreement ASI/INAF I/037/12/0 and from PRIN INAF 2014. This paper is based on data from observations with INTEGRAL, and XMM-Newton. INTEGRAL is an ESA project with instruments and science data centre funded by ESA member states (especially the PI countries: Denmark, France, Germany, Italy, Spain, and Switzerland), Czech Republic and Poland, and with the participation of Russia and the USA. XMM-Newton is an ESA science mission with instruments and contributions directly funded by ESA Member States and NASA. This research has made use of data and/or software provided by the High Energy Astrophysics Science Archive Research Center (HEASARC), which is a service of the Astrophysics Science Division at NASA/GSFC and the High Energy Astrophysics Division of the Smithsonian Astrophysical Observatory. This research has made use of SAOImage DS9, developed by Smithsonian Astrophysical Observatory.
References
- Bélanger, G., Goldwurm, A., Renaud, M., et al. 2006, ApJ, 636, 275 [Google Scholar]
- Courvoisier, T. J.-L., Walter, R., Beckmann, V., et al. 2003, A&A, 411, L53 [NASA ADS] [CrossRef] [EDP Sciences] [Google Scholar]
- Esposito, P., Mereghetti, S., Tiengo, A., et al. 2007, A&A, 461, 605 [NASA ADS] [CrossRef] [EDP Sciences] [Google Scholar]
- Fenimore, E. E., & Cannon, T. M. 1978, Appl. Opt., 17, 337 [NASA ADS] [CrossRef] [PubMed] [Google Scholar]
- Frontera, F., Costa, E., dal Fiume, D., et al. 1997, A&AS, 122, 357 [Google Scholar]
- Goldwurm, A., David, P., Foschini, L., et al. 2003, A&A, 411, L223 [NASA ADS] [CrossRef] [EDP Sciences] [Google Scholar]
- Golenetskii, S., Aptekar, R., Mazets, E., et al. 2006, GRB Coordinates Network, 4936, 1 [NASA ADS] [Google Scholar]
- Götz, D., Mereghetti, S., Tiengo, A., & Esposito, P. 2006, A&A, 449, L31 [NASA ADS] [CrossRef] [EDP Sciences] [Google Scholar]
- Göǧüş, E., Güver, T., Özel, F., Eichler, D., & Kouveliotou, C. 2011, ApJ, 728, 160 [NASA ADS] [CrossRef] [Google Scholar]
- Hurley, K., Mazets, E., Golenetskii, S., & Cline, T. 2002, GRB Coordinates Network, 1715, 1 [NASA ADS] [Google Scholar]
- Kaspi, V. M., & Boydstun, K. 2010, ApJ, 710, L115 [NASA ADS] [CrossRef] [Google Scholar]
- Krivonos, R., Revnivtsev, M., Tsygankov, S., et al. 2010, A&A, 519, A107 [NASA ADS] [CrossRef] [EDP Sciences] [Google Scholar]
- Lebrun, F., Leray, J. P., Lavocat, P., et al. 2003, A&A, 411, L141 [NASA ADS] [CrossRef] [EDP Sciences] [Google Scholar]
- Li, J., Torres, D. F., Chen, Y., et al. 2011, ApJ, 738, L31 [NASA ADS] [CrossRef] [Google Scholar]
- Mereghetti, S., Esposito, P., Tiengo, A., et al. 2006, ApJ, 653, 1423 [NASA ADS] [CrossRef] [Google Scholar]
- Mereghetti, S., Pons, J. A., & Melatos, A. 2015, Space Sci. Rev. [arXiv:1503.06313] [Google Scholar]
- Nakagawa, Y. E., Mihara, T., Yoshida, A., et al. 2009, PASJ, 61, 387 [NASA ADS] [Google Scholar]
- Primini, F. A., Forman, W., & Jones, C. 1993, ApJ, 410, 615 [NASA ADS] [CrossRef] [Google Scholar]
- Tiengo, A., Esposito, P., Mereghetti, S., et al. 2007, Ap&SS, 308, 33 [NASA ADS] [CrossRef] [Google Scholar]
- Ubertini, P., Lebrun, F., Di Cocco, G., et al. 2003, A&A, 411, L131 [NASA ADS] [CrossRef] [EDP Sciences] [Google Scholar]
- Vetere, L., Barthelmy, S. D., Kennea, J. A., Markwardt, C. B., & Palmer, D. M. 2006, GRB Coordinates Network, 4922, 1 [NASA ADS] [Google Scholar]
- Vogel, J. K., Hascoët, R., Kaspi, V. M., et al. 2014, ApJ, 789, 75 [NASA ADS] [CrossRef] [Google Scholar]
- Vrba, F. J., Henden, A. A., Luginbuhl, C. B., et al. 2000, ApJ, 533, L17 [NASA ADS] [CrossRef] [Google Scholar]
- Winkler, C., Courvoisier, T. J.-L., Di Cocco, G., et al. 2003, A&A, 411, L1 [NASA ADS] [CrossRef] [EDP Sciences] [Google Scholar]
All Tables
All Figures
|
Fig. 1 IBIS/ISGRI mosaic image (in cts s-1) of the SGR 1900+14 field in the 22−50 keV band. |
| In the text | |
|
Fig. 2 22−50 keV IBIS/ISGRI lightcurve of SGR 1900+14. Time intervals and rates are given in Table 1. |
| In the text | |
|
Fig. 3 Joint XMM-Newton (red), IBIS/ISGRI (black) spectrum fitted with an absorbed power law plus a blackbody model, with residuals in units of standard deviations. |
| In the text | |
|
Fig. 4 Spectral turnover Γs−Γh as function of the magnetic field B (left panel) and spin-down |
| In the text | |
Current usage metrics show cumulative count of Article Views (full-text article views including HTML views, PDF and ePub downloads, according to the available data) and Abstracts Views on Vision4Press platform.
Data correspond to usage on the plateform after 2015. The current usage metrics is available 48-96 hours after online publication and is updated daily on week days.
Initial download of the metrics may take a while.