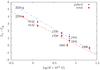
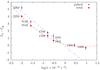
Fig. 4

Spectral turnover Γs−Γh as function of the magnetic field B (left panel) and spin-down ![]() (right panel) for all magnetars for which Γs and Γh are measured. Red circles represent total flux and blue triangles represent pulsed flux. Error bars represent 1σ uncertainties. Linear fits are shown on the left panel, both for pulsed flux (blue line) and total flux (red line), and on the right panel for pulsed flux (blue line). For total flux data in the right panel, the best-fitting quadratic trend is shown. The figure is an updated version of Fig. 9 of Vogel et al. (2014), with the new value of Γs−Γh for SGR 1900+14 obtained in this work.
(right panel) for all magnetars for which Γs and Γh are measured. Red circles represent total flux and blue triangles represent pulsed flux. Error bars represent 1σ uncertainties. Linear fits are shown on the left panel, both for pulsed flux (blue line) and total flux (red line), and on the right panel for pulsed flux (blue line). For total flux data in the right panel, the best-fitting quadratic trend is shown. The figure is an updated version of Fig. 9 of Vogel et al. (2014), with the new value of Γs−Γh for SGR 1900+14 obtained in this work.
Current usage metrics show cumulative count of Article Views (full-text article views including HTML views, PDF and ePub downloads, according to the available data) and Abstracts Views on Vision4Press platform.
Data correspond to usage on the plateform after 2015. The current usage metrics is available 48-96 hours after online publication and is updated daily on week days.
Initial download of the metrics may take a while.