Fig. 7
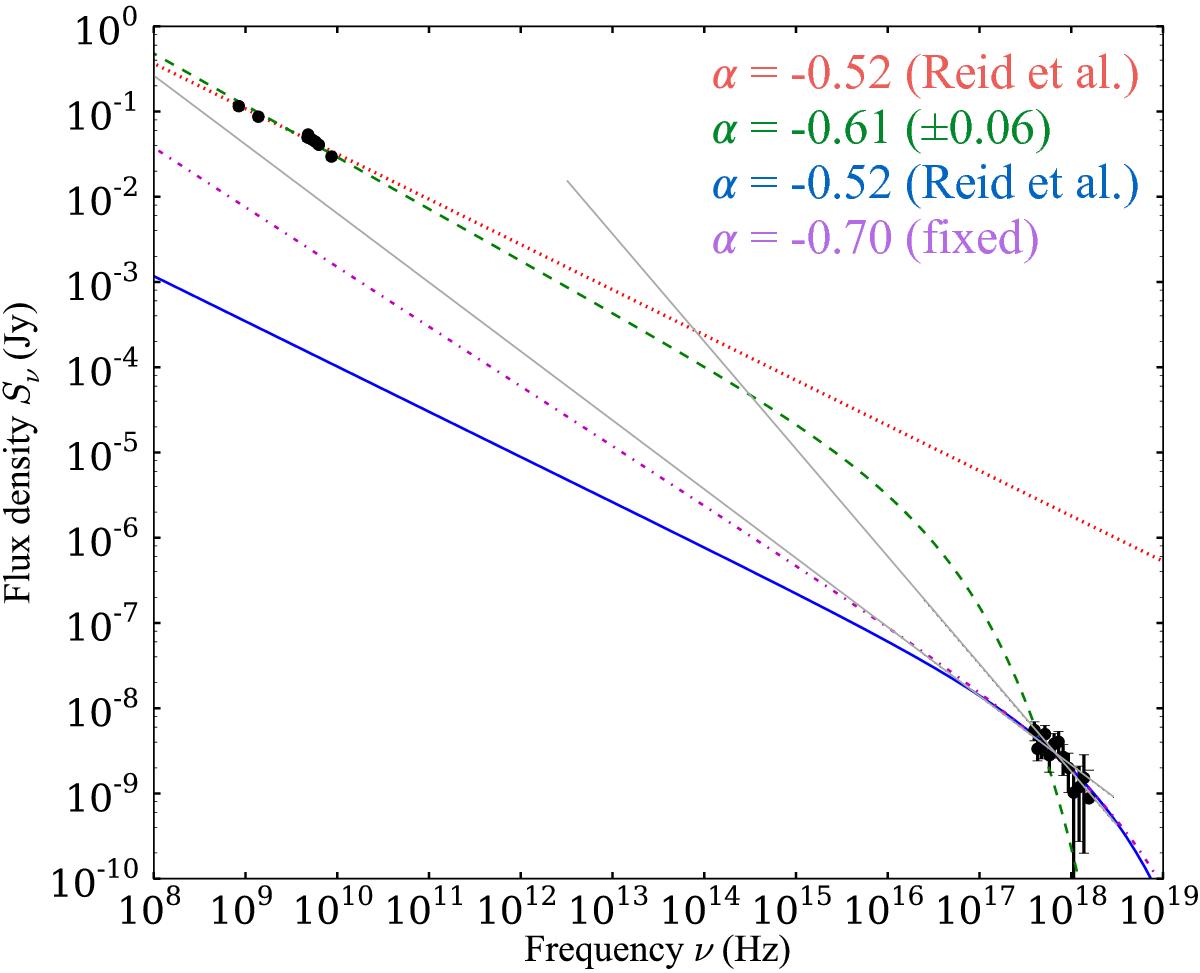
SED of MCSNR J0512−6707. The data points at the lower frequencies are the radio flux densities reported in Reid et al. (2015). The data at the higher frequencies correspond to the background-subtracted EPIC-pn spectrum from Obs. ID 0741800201 in the 2–7 keV range, which excludes the contribution of the soft X-ray component. The red dotted line shows the power-law fit to the radio data, the green dashed line shows the exponentially cut-off power law fit to the entire SED, the magenta dash-dot line shows the exponentially cut-off power law fit to the X-ray data with α fixed to −0.7, and the blue solid line shows the exponentially cut-off power law fit to the X-ray data with α fixed to –0.52 determined by Reid et al. (2015). The grey lines indicate the upper and lower limit of the photon index in the X-ray power law fit (see Table 1).
Current usage metrics show cumulative count of Article Views (full-text article views including HTML views, PDF and ePub downloads, according to the available data) and Abstracts Views on Vision4Press platform.
Data correspond to usage on the plateform after 2015. The current usage metrics is available 48-96 hours after online publication and is updated daily on week days.
Initial download of the metrics may take a while.