Fig. 3
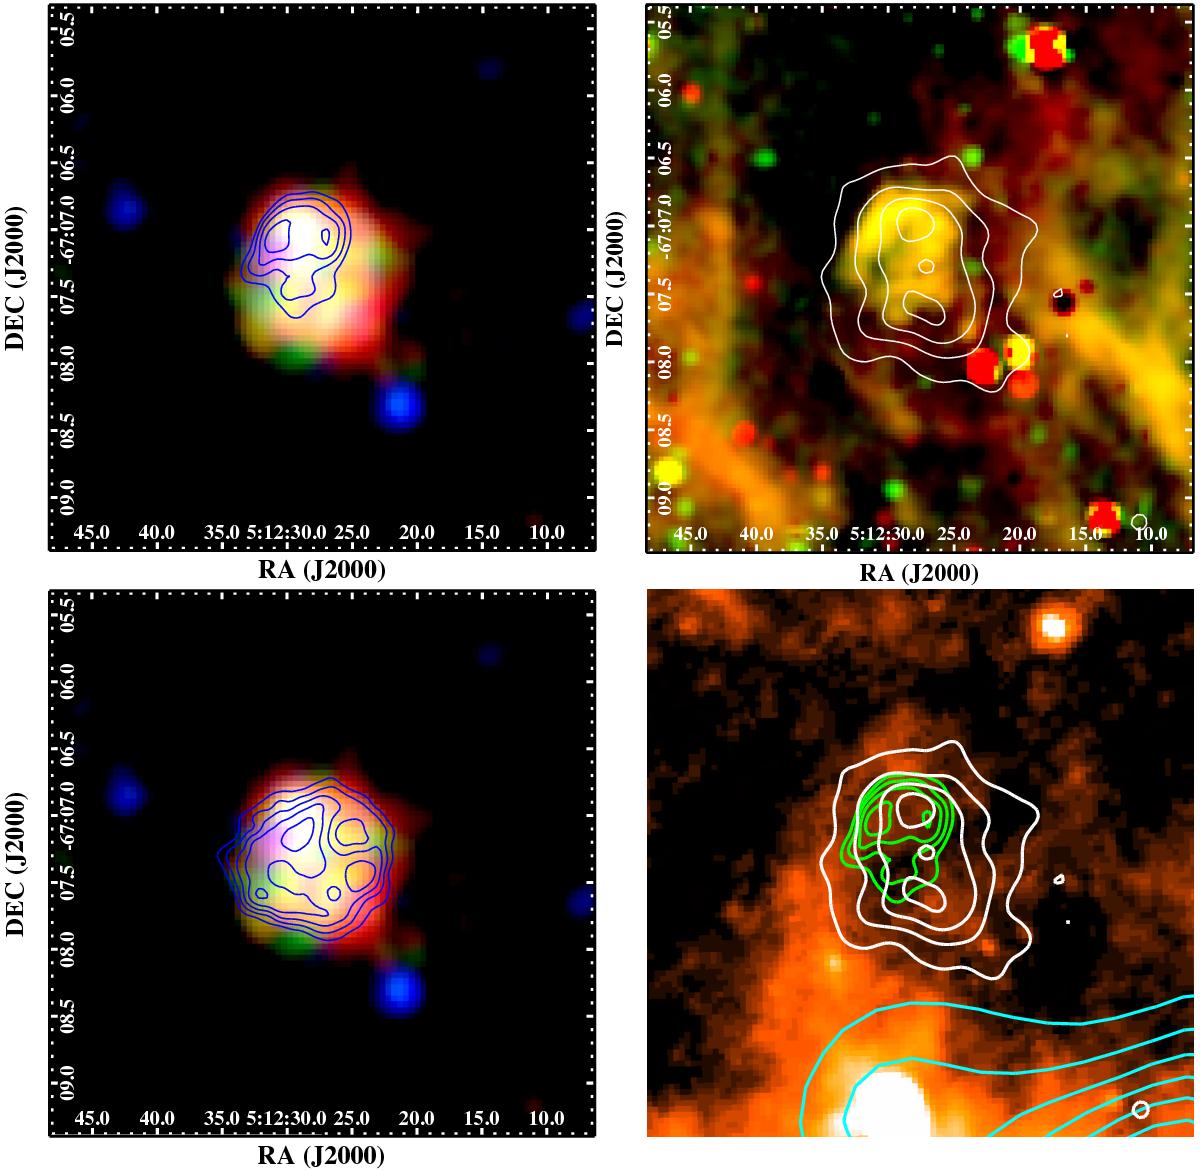
Top left: XMM-Newton EPIC image of MCSNR J0512−6707 in false colour with RGB corresponding to 0.3–0.7 keV, 0.7–1.1 keV, and 1.1–4.2 keV. The image is overlaid with [S ii]/Hα contours with the lowest level corresponding to [S ii]/Hα = 0.4, and the remaining levels at 25%, 50%, and 75% of the maximum above this level. Top right: continuum subtracted MCELS image of MCSNR J0512−6707 with Hα in red and [S ii] shown in green overlaid with 0.3–0.7 keV contours. The lowest contour level represents 3σ above the average background surface brightness, with the remaining levels marking 25%, 50%, and 75% of the maximum above this level. Bottom left: same as top left but with 20 cm radio contours from Fig. 1 overlaid. The contours are at 1.5, 2.0, 2.5, 3.0, and 3.5 mJy/beam. Bottom right: Spitzer MIPS 24 μm image of the MCSNR J0512−6707 region with the X-ray contours from top right in white and [S ii]/Hα contours from top left in green. The cyan contours represent the CO emission from the MAGMA survey and delineate the location of the molecular cloud [WHO2011] A126. The lowest level corresponds to 1.2 K km s-1 (the approximate sensitivity limit of the survey), increasing in steps of 1 K km s-1. The image scale is the same as in all other panels.
Current usage metrics show cumulative count of Article Views (full-text article views including HTML views, PDF and ePub downloads, according to the available data) and Abstracts Views on Vision4Press platform.
Data correspond to usage on the plateform after 2015. The current usage metrics is available 48-96 hours after online publication and is updated daily on week days.
Initial download of the metrics may take a while.