Fig. 8
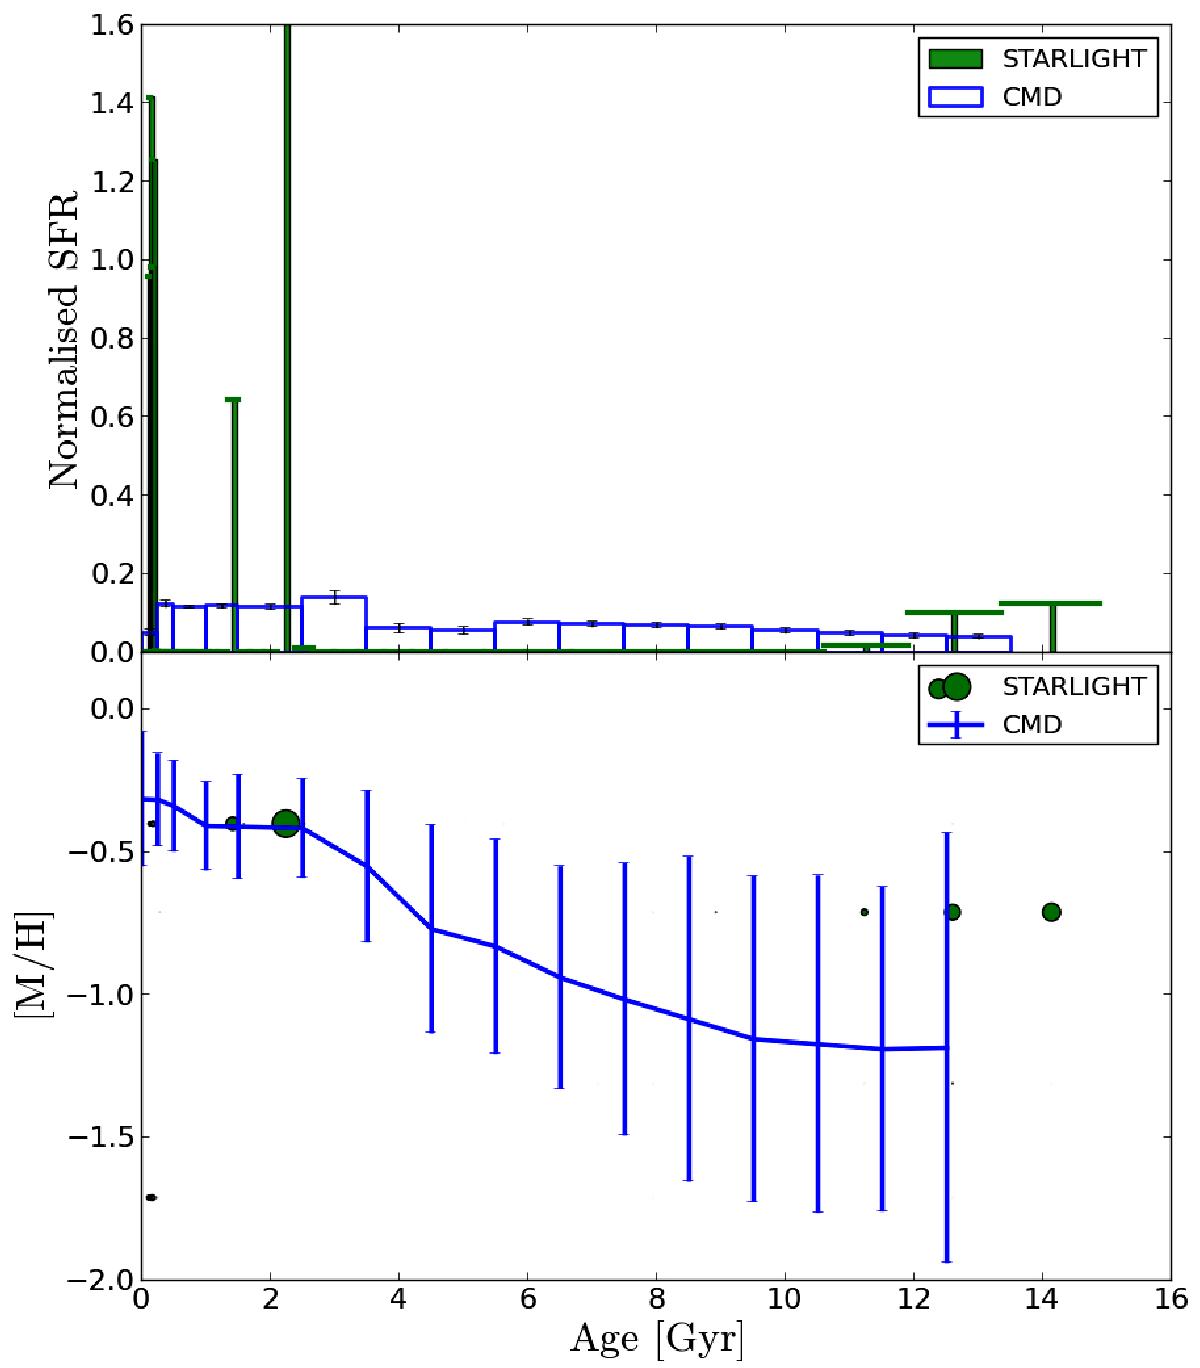
Top panel: SFH from STARLIGHT with Vazdekis et al. (2010) models younger than 13.5 Gyr. Bottom panel: age-metallicity relation from the STARLIGHT results. SFH: we note that the representation of the SFH is different to the case of STECKMAP (see Fig. 4). In this case we use SSPs with no smoothing applied and thus, vertical lines are chosen to show the mass contribution of the different SSPs instead of a bar plot. However, for a fair comparison, a similar normalization has been applied. Horizontal lines represent the Δt used in this case (computed based on the base of stellar models used). For further information see Fig. 4. AMR: green points represent the age and metallicity of the different single stellar populations with a non-zero weight in the fit. The point size is proportional to the weights.
Current usage metrics show cumulative count of Article Views (full-text article views including HTML views, PDF and ePub downloads, according to the available data) and Abstracts Views on Vision4Press platform.
Data correspond to usage on the plateform after 2015. The current usage metrics is available 48-96 hours after online publication and is updated daily on week days.
Initial download of the metrics may take a while.