Fig. 4
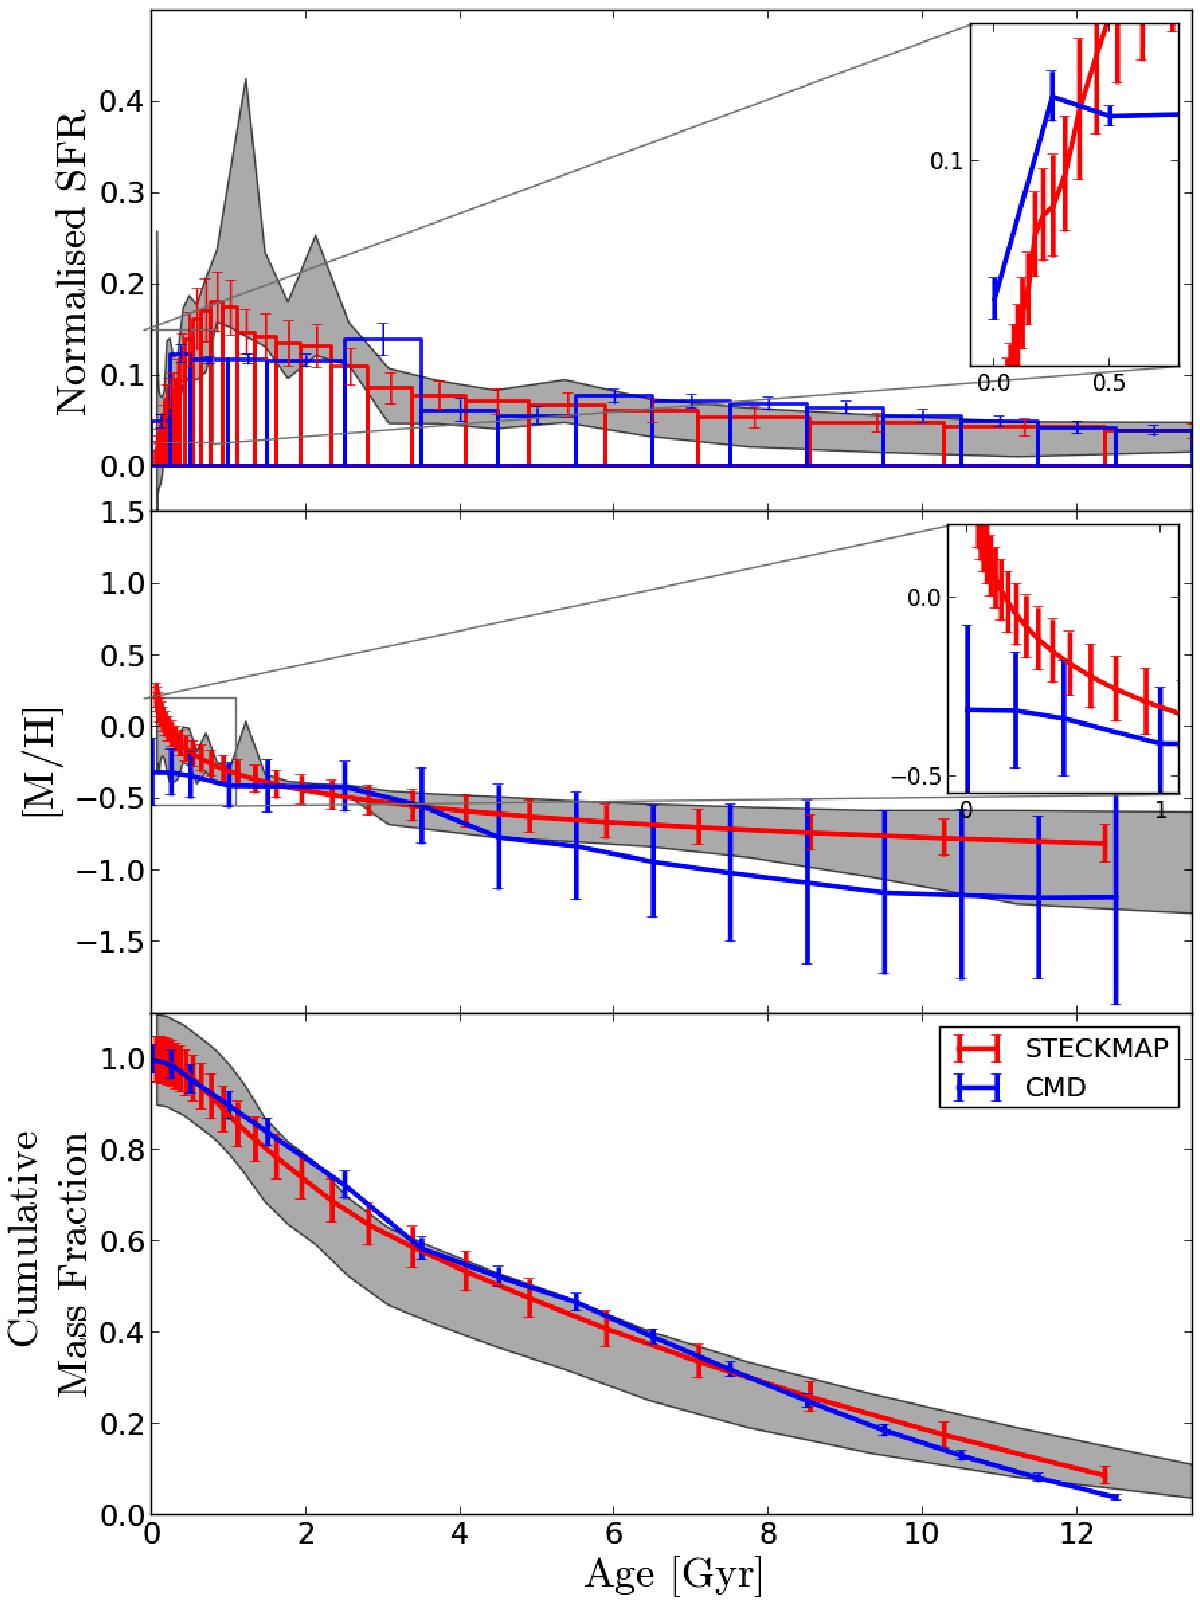
Comparison between the LMC bar SFH from the CMD and the integrated spectrum using STECKMAP (test 24). The three panels show, from top to bottom, the normalized SFR (t), the age-metallicity relation, and the cumulative mass fraction with a zoom at young ages for the normalized SFR (t) and the AMR. We plot the envelope of the histograms in the main plots in the insets. In order to make a fair comparison a normalization is needed. We normalize the SFR (t) in such a way that the sum of the areas of the different rectangles (SFR [M⊙/yr] ×Δt) is 1 (upper panel). The AMR plot shows the average metallicity at every age bin. Error bars are 1σ of the resulting distribution of solutions from a series of 25 Monte Carlo simulations in the case of STECKMAP and 600 different solutions by applying small shifts in the CMD for the CMD analysis (see text for details). The shaded regions correspond to the mean values and standard deviations of all the solutions using MILES and ages ranging from 0.063 to 13.5 Gyr (tests 3, 7, 17, 18, 19, 20, 21, 22, 23, and 24).
Current usage metrics show cumulative count of Article Views (full-text article views including HTML views, PDF and ePub downloads, according to the available data) and Abstracts Views on Vision4Press platform.
Data correspond to usage on the plateform after 2015. The current usage metrics is available 48-96 hours after online publication and is updated daily on week days.
Initial download of the metrics may take a while.