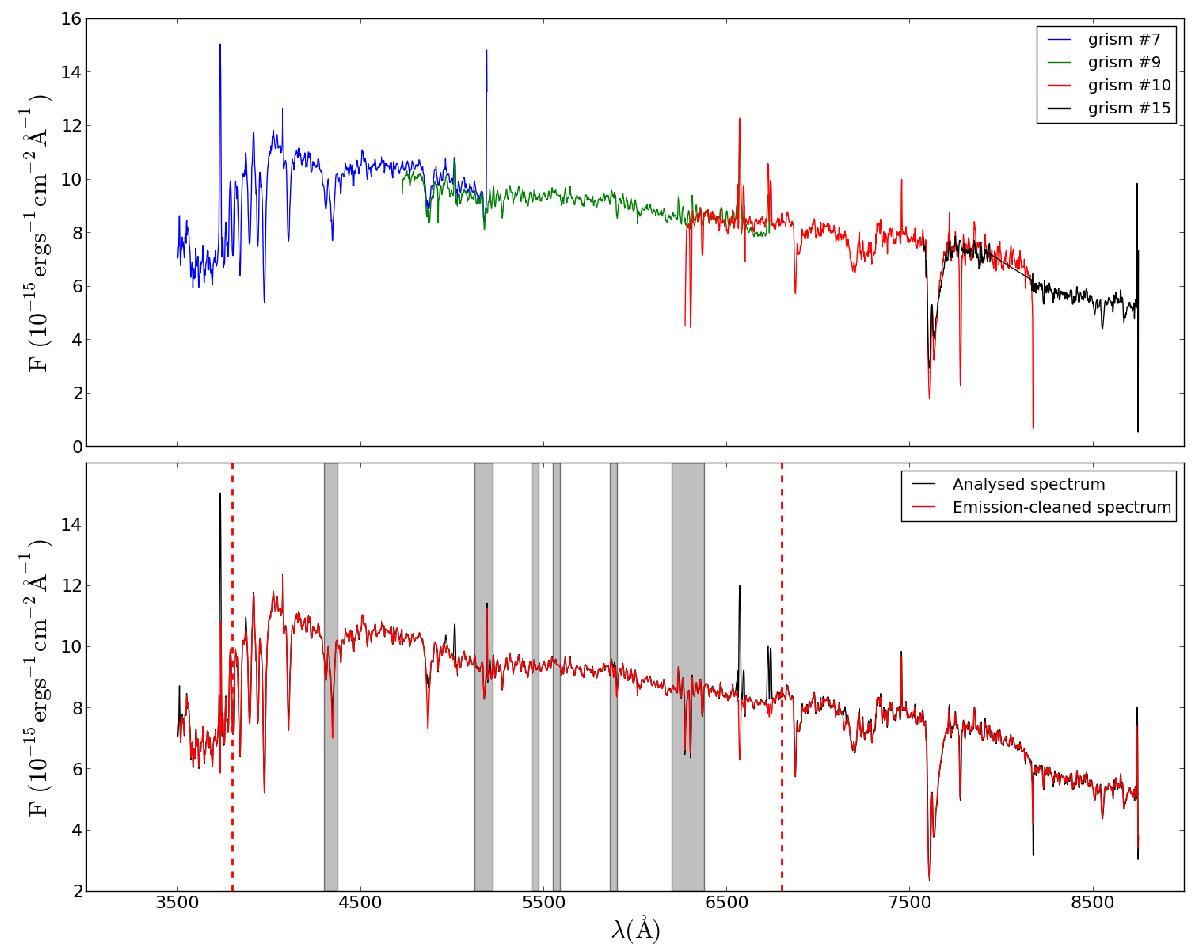
Fig. 3

Composite spectrum of the LMC bar field used in the integrated stellar population analysis. Top row: the spectrum is divided according to the four different grisms used: Blue for grism # 7 (3500–5185 Å), green for grism # 9 (4725–6730 Å), red for grism # 10 (6275–8160 Å), and black for grism # 15 (7565–8745). For each grism the corresponding sky spectrum, i.e. the spectrum taken in the sky field, has been subtracted. Only the LMC bar contribution is shown here. Bottom row: fully reduced composite spectrum of the LMC bar (black) and fully reduced, emission-cleaned composite spectrum (red). For the stellar content analysis we use the wavelength range from 3800 to 6800 Å (dashed vertical red lines; see text for details). The shaded regions of the spectrum are the masked regions (not considered in the fit).
Current usage metrics show cumulative count of Article Views (full-text article views including HTML views, PDF and ePub downloads, according to the available data) and Abstracts Views on Vision4Press platform.
Data correspond to usage on the plateform after 2015. The current usage metrics is available 48-96 hours after online publication and is updated daily on week days.
Initial download of the metrics may take a while.


