Fig. 11
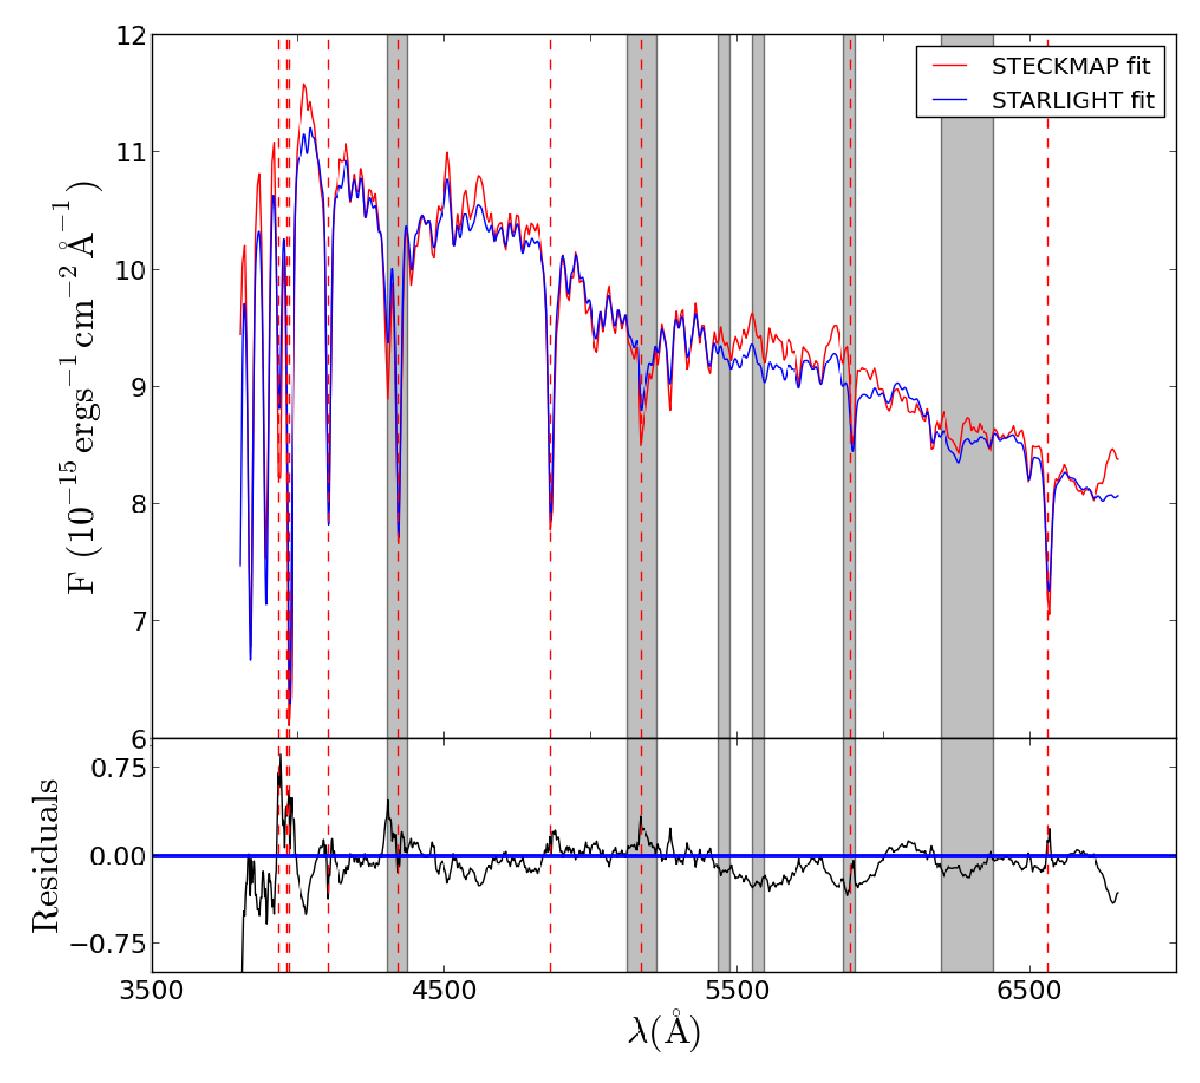
Comparison between the STECKMAP and STARLIGHT (using spectral templates mimicking constant SFR) best models. Top panel: the STECKMAP best model is plotted in red. The STARLIGHT best model is plotted in blue. Bottom panel: residuals of both best models (STECKMAP – STARLIGHT). The shaded regions of the spectrum are the masked regions (not considered in the fits). Vertical, dashed red lines are located at the wavelengths of the main stellar absorption features. The residuals are in units of 10-15 erg-1 cm-2 Å-1.
Current usage metrics show cumulative count of Article Views (full-text article views including HTML views, PDF and ePub downloads, according to the available data) and Abstracts Views on Vision4Press platform.
Data correspond to usage on the plateform after 2015. The current usage metrics is available 48-96 hours after online publication and is updated daily on week days.
Initial download of the metrics may take a while.