Fig. 10
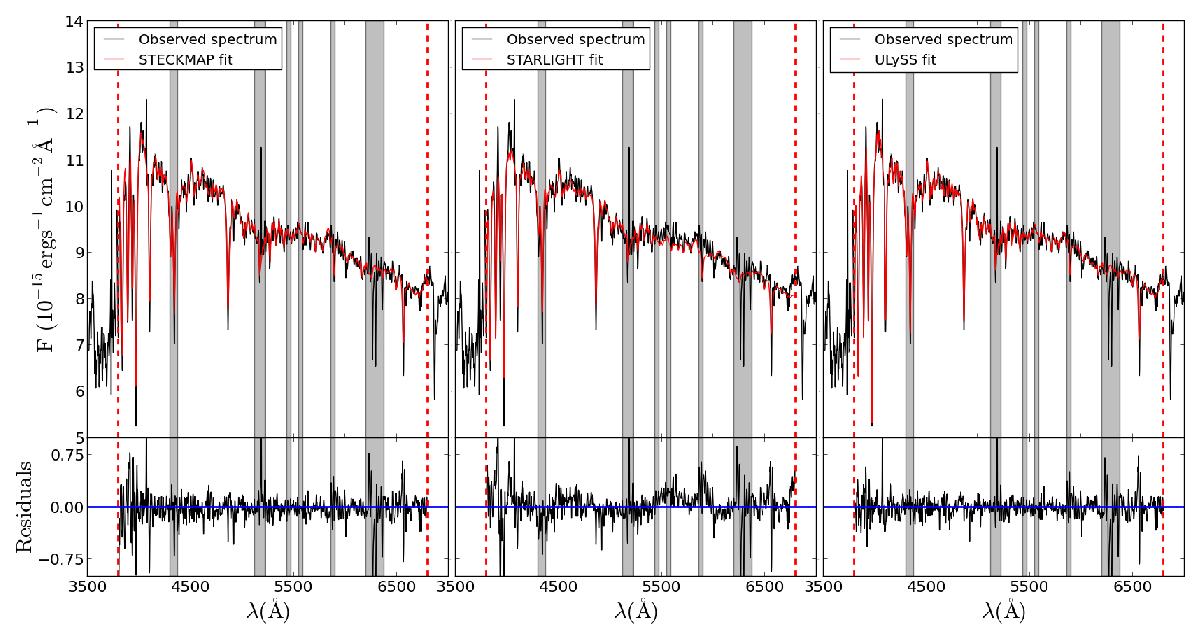
Top panels: comparison between the observed spectrum and the fit from STECKMAP (left), STARLIGHT (middle), and ULySS (right). For STARLIGHT and ULySS we use the “constant SFR” approach. Black: fully reduced, emission-cleaned composite spectrum of the LMC bar. Red: fit from the different codes. Bottom panels: residuals of those fits computed as observed – best model. For the stellar content analysis we use the wavelength range from 3800 to 6800 Å (dashed vertical red lines; see text for details). The shaded regions of the spectrum are the masked regions (not considered in the fits). The residuals are in units of 10-15 erg-1 cm-2 Å-1.
Current usage metrics show cumulative count of Article Views (full-text article views including HTML views, PDF and ePub downloads, according to the available data) and Abstracts Views on Vision4Press platform.
Data correspond to usage on the plateform after 2015. The current usage metrics is available 48-96 hours after online publication and is updated daily on week days.
Initial download of the metrics may take a while.