Fig. 9
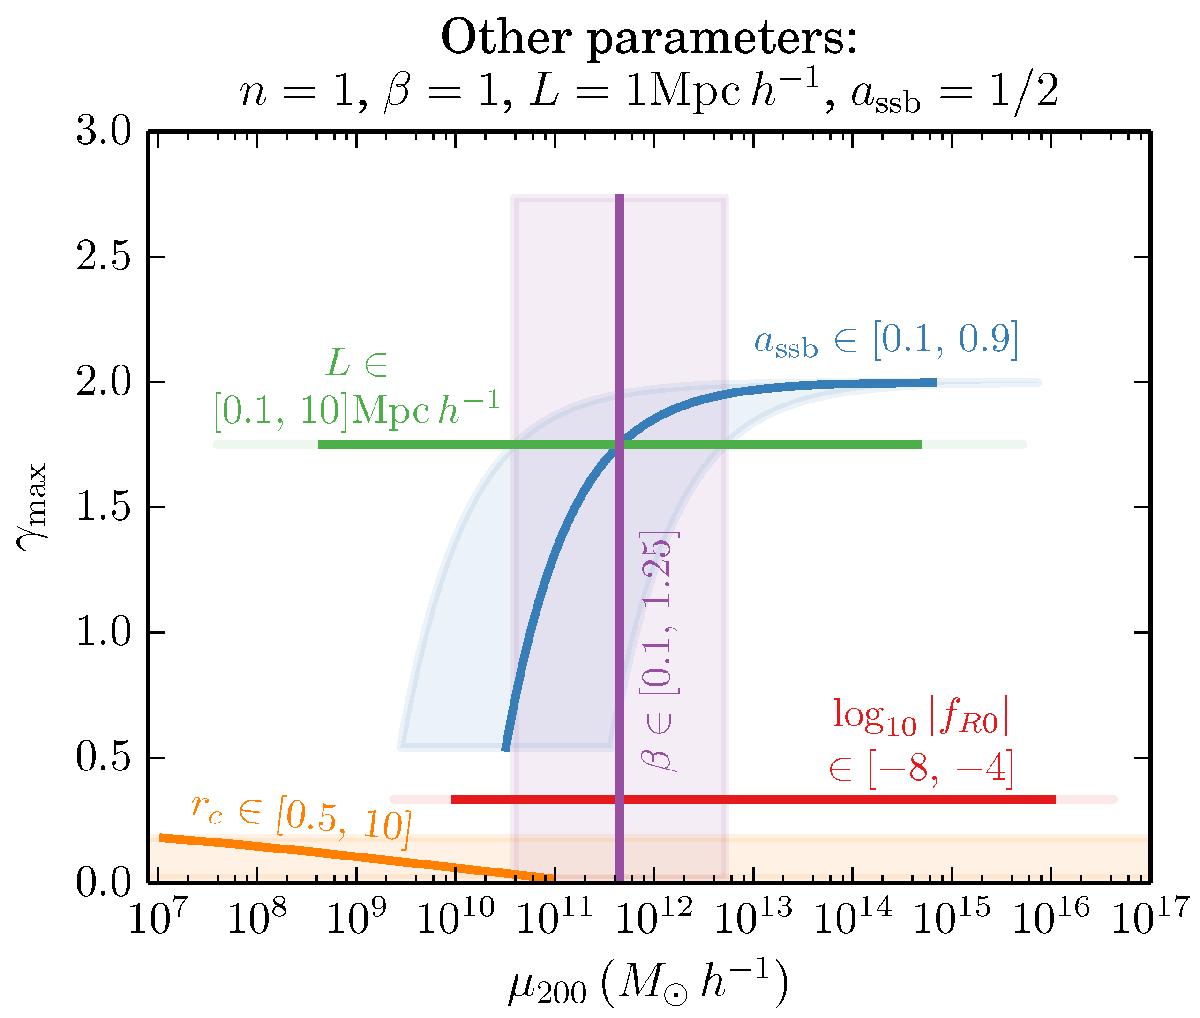
Rescaling parameter μ200 versus the maximum gravitational enhancement γmax for several discussed models (solid colored lines) and the respective partially screened regions (colored semi-transparent areas). The red line shows the space spanned by the Hu-Sawicki f(R) model when varying | fR0 | from 10-8 (left end) to 10-4 (right end), while leaving n = 1 fixed. For the Symmetron, we also varied one parameter per curve (in blue, green, and violet), while leaving the others fixed at β = 1, L = 1 Mpc h-1, assb = 1/2. The orange line indicates the region for nDGP models with rc ∈ [0.5, 10] (left to right) with the associated semi-transparent area spanning wider than the plot range. See Sect. 4.1 for details.
Current usage metrics show cumulative count of Article Views (full-text article views including HTML views, PDF and ePub downloads, according to the available data) and Abstracts Views on Vision4Press platform.
Data correspond to usage on the plateform after 2015. The current usage metrics is available 48-96 hours after online publication and is updated daily on week days.
Initial download of the metrics may take a while.