Fig. 5
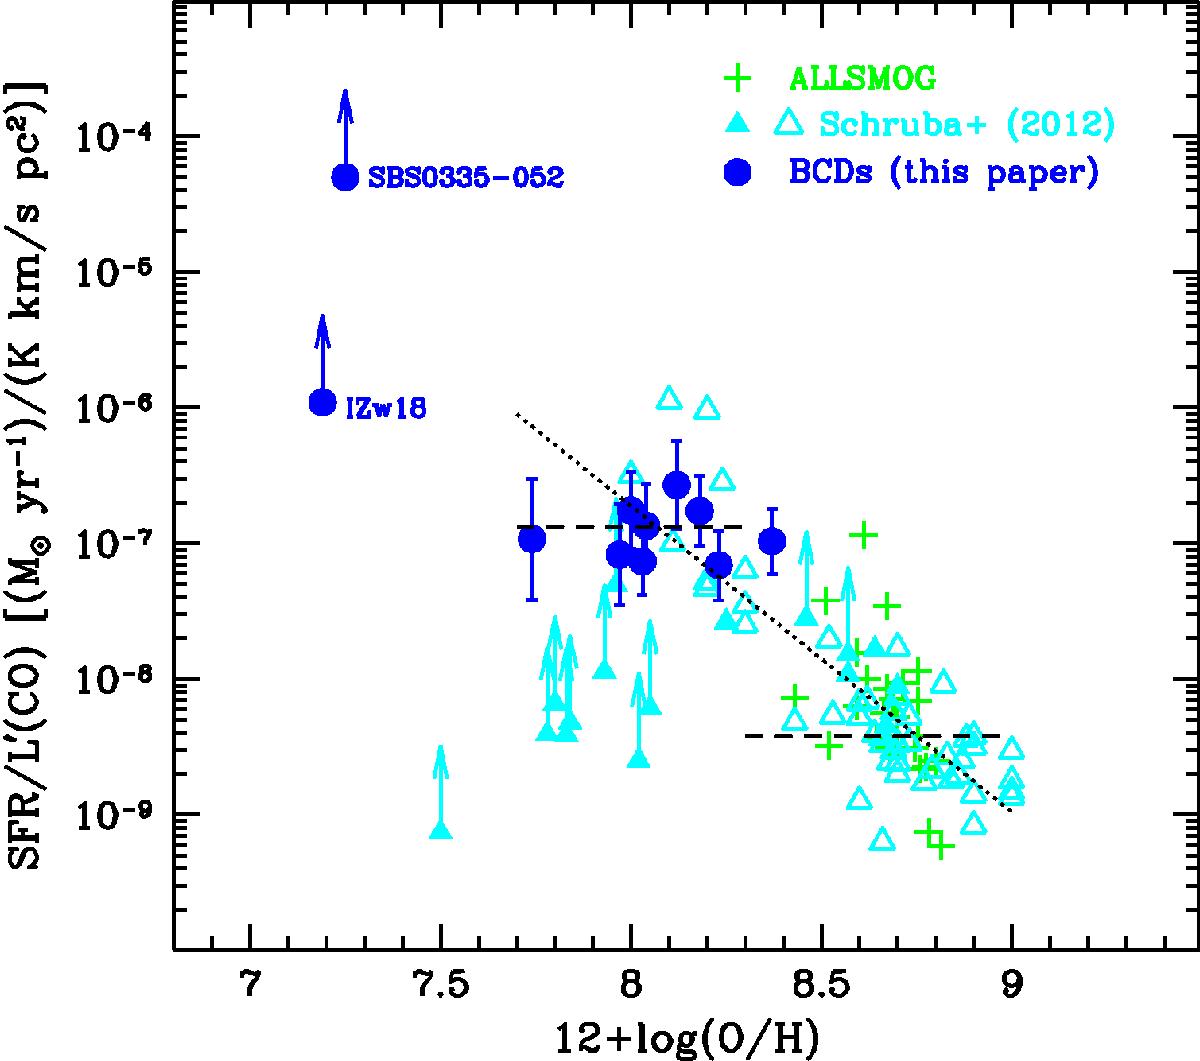
SFR/![]() vs. 12 + log(O/H) for our sample and additional galaxies from the literature. As discussed in Sect. 2.2, we include I Zw 18 as one of our sources (see also Schruba et al. 2012). The open triangles for Schruba et al. (2012) correspond to their compilation of literature data and the filled ones to their metal-poor dwarf observations. CO non-detections are shown by upward arrows. The two horizontal dashed lines correspond to the regressions with unit slope shown in Fig. 4, and the dotted one to a robust regression as described in the text: log(SFR/
vs. 12 + log(O/H) for our sample and additional galaxies from the literature. As discussed in Sect. 2.2, we include I Zw 18 as one of our sources (see also Schruba et al. 2012). The open triangles for Schruba et al. (2012) correspond to their compilation of literature data and the filled ones to their metal-poor dwarf observations. CO non-detections are shown by upward arrows. The two horizontal dashed lines correspond to the regressions with unit slope shown in Fig. 4, and the dotted one to a robust regression as described in the text: log(SFR/![]() ) = (− 2.25 ± 0.15) [12 + log(O/H)] + (11.31 ± 1.3).
) = (− 2.25 ± 0.15) [12 + log(O/H)] + (11.31 ± 1.3).
Current usage metrics show cumulative count of Article Views (full-text article views including HTML views, PDF and ePub downloads, according to the available data) and Abstracts Views on Vision4Press platform.
Data correspond to usage on the plateform after 2015. The current usage metrics is available 48-96 hours after online publication and is updated daily on week days.
Initial download of the metrics may take a while.