Fig. 15
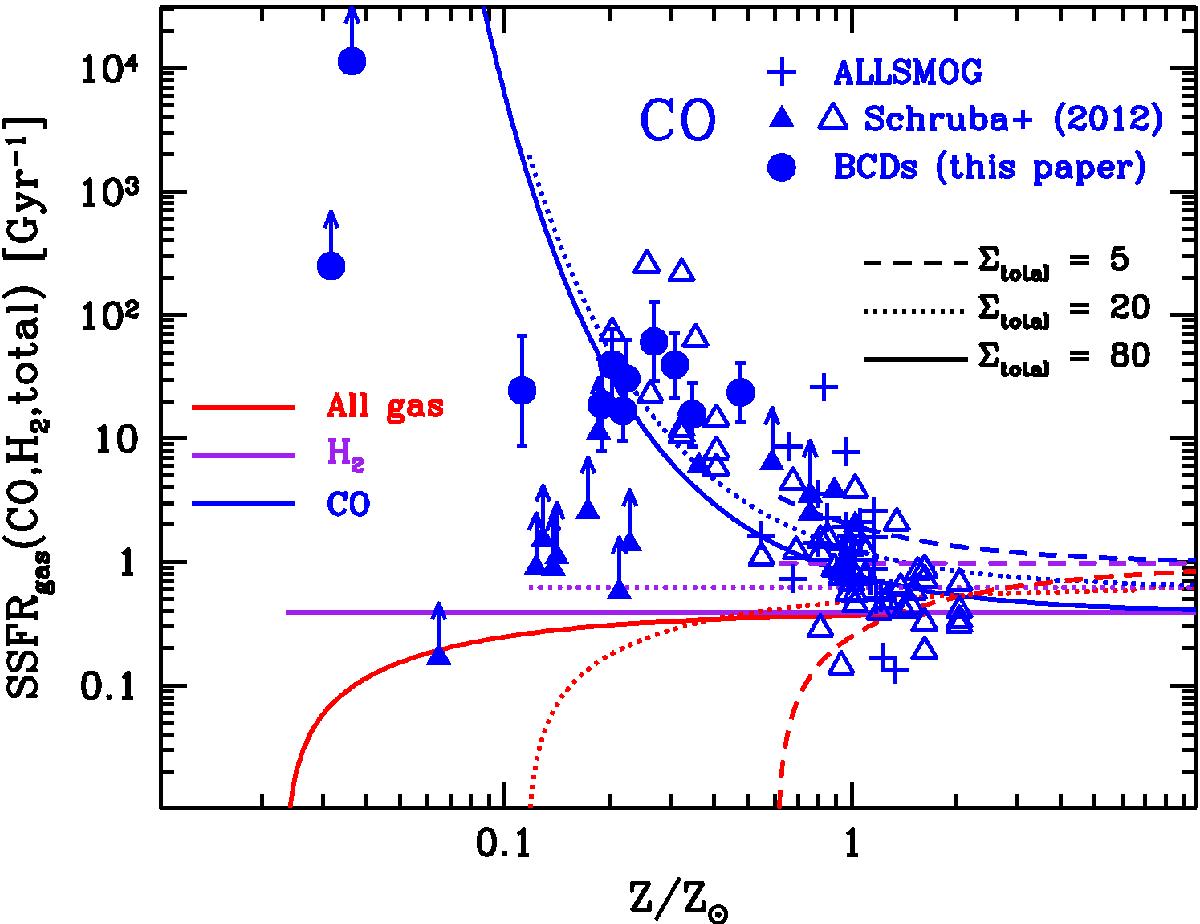
Ratio of SFR and CO-inferred H2 mass vs. relative metallicity as described in the text, including our data and data from the literature (COLDGASS: Schruba et al. 2012; Bothwell et al. 2014). As in previous figures, the open triangles for Schruba et al. (2012) correspond to their compilation of data from the literature and the filled ones to their metal-poor dwarf observations. Following Krumholz et al. (2011), here MH2 is inferred with a constant αCO = 4.4 M⊙ (K km s-1 pc2)-1, as described in the text. Also shown are the predictions by Krumholz et al. (2011), showing three values for total gas surface density, Σgas: 5 M⊙ pc-2, 20 M⊙ pc-2, and 80 M⊙ pc-2 indicated by dashed, dotted, and solid lines, respectively. Total gas corresponds to red, purple to H2, and blue to CO.
Current usage metrics show cumulative count of Article Views (full-text article views including HTML views, PDF and ePub downloads, according to the available data) and Abstracts Views on Vision4Press platform.
Data correspond to usage on the plateform after 2015. The current usage metrics is available 48-96 hours after online publication and is updated daily on week days.
Initial download of the metrics may take a while.