Fig. 10
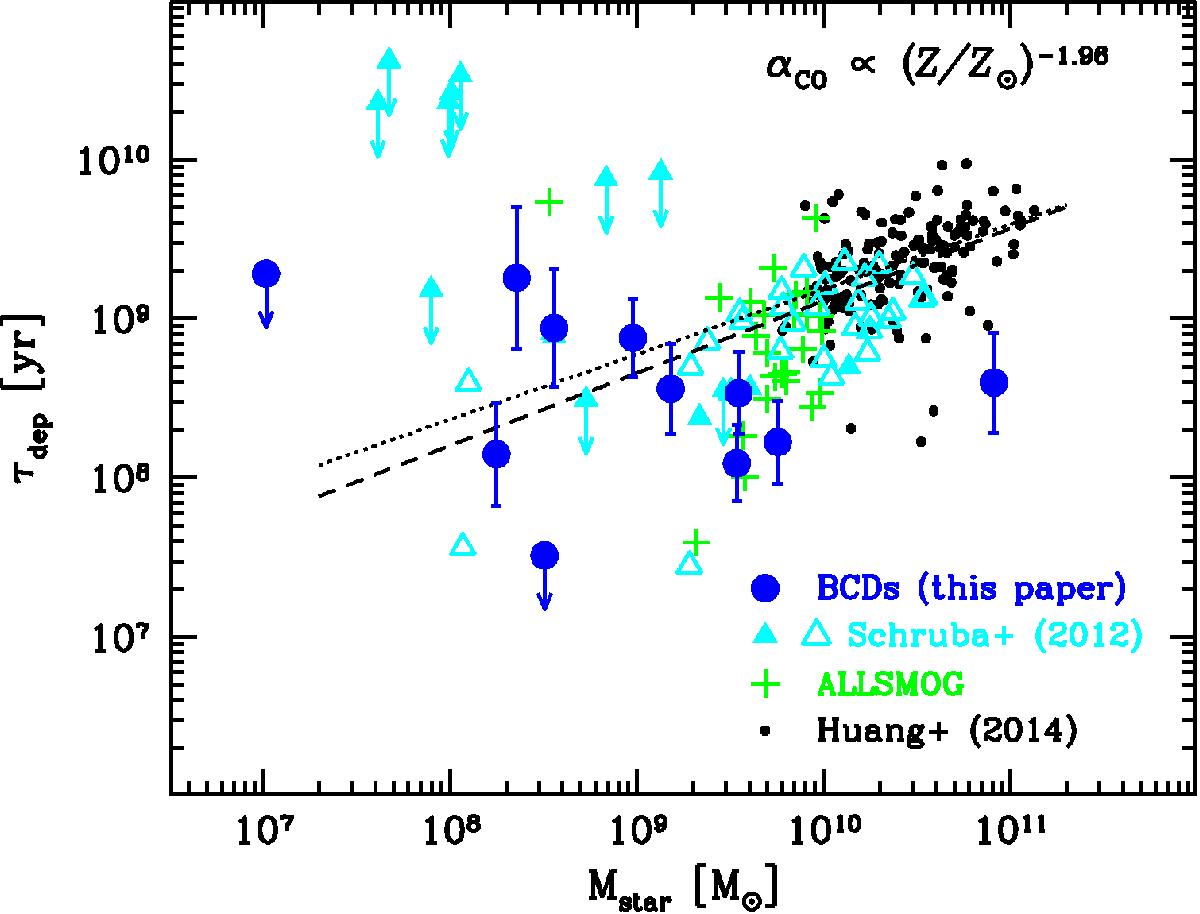
τdep vs. Mstar for our sample and including data from the literature (Huang & Kauffmann 2014; Schruba et al. 2012; Bothwell et al. 2014). As in previous figures, the open triangles for Schruba et al. (2012) correspond to their compilation of data from the literature and the filled ones to their metal-poor dwarf observations. Our robust best-fit regression for these samples is shown as a dashed line; the dotted line corresponds to the slope for the COLDGASS galaxies alone (Huang & Kauffmann 2014).
Current usage metrics show cumulative count of Article Views (full-text article views including HTML views, PDF and ePub downloads, according to the available data) and Abstracts Views on Vision4Press platform.
Data correspond to usage on the plateform after 2015. The current usage metrics is available 48-96 hours after online publication and is updated daily on week days.
Initial download of the metrics may take a while.