Fig. 8
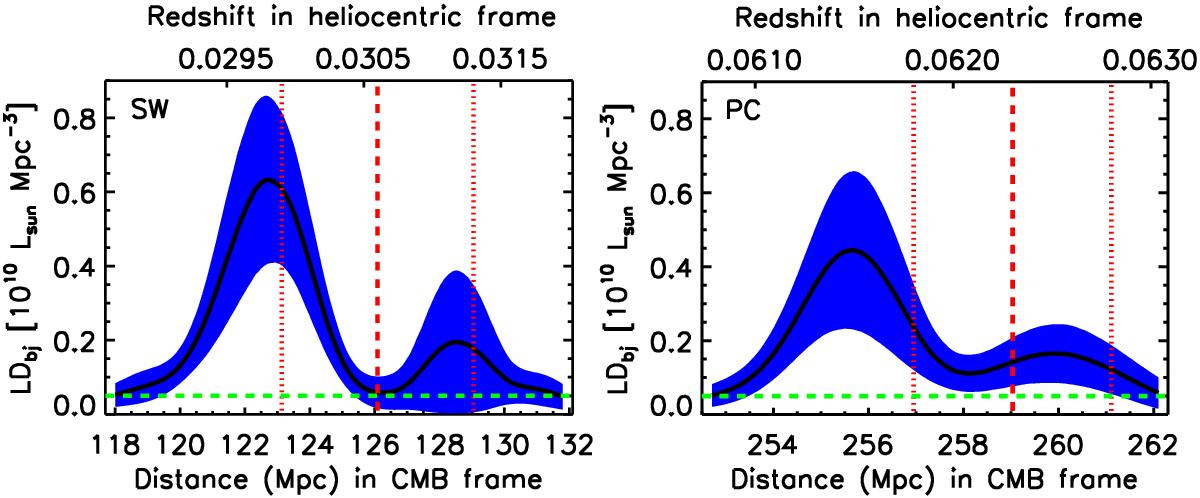
2dF bj band luminosity density profiles of the SW (left panel) and PC (right panel) along the H2356-309 sight line (solid black lines) together with 1σ uncertainties (blue regions). The horizontal (green dashed line) indicates our adopted lower LD threshold LDbj,min = 0.05 × 10¹⁰L⊙ Mpc-3 for extracting the data for further analysis. The vertical dashed lines indicate the best-fit heliocentric redshifts of the Chandra X-ray lines, while the dotted lines bracket the statistical 1σ uncertainties of the redshifts (from F10 and Z10). The co-moving distances refer to the CMB rest frame.
Current usage metrics show cumulative count of Article Views (full-text article views including HTML views, PDF and ePub downloads, according to the available data) and Abstracts Views on Vision4Press platform.
Data correspond to usage on the plateform after 2015. The current usage metrics is available 48-96 hours after online publication and is updated daily on week days.
Initial download of the metrics may take a while.