Fig. 7
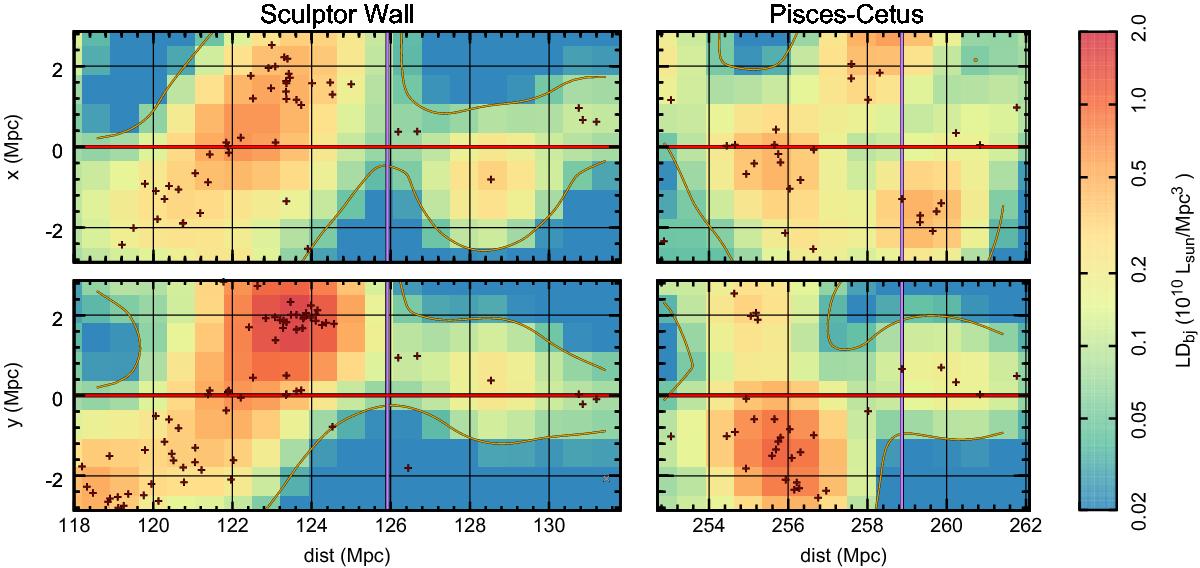
2dF bj band luminosity density field slices of 1.4 Mpc thickness in two orthogonal directions (upper and lower panels) along the line of sight towards the blazar H2356-309 (red horizontal lines) in the SW (left panels) and PC (right panels) structures. The contours indicate our adopted lower LD threshold LDbj,min = 0.05 × 10¹⁰ L⊙ Mpc-3 for extracting the data for further analysis. The radial ranges equal those used for the luminosity density profile analysis (see Fig. 8). The galaxies relevant to the sight line, i.e. within a distance of two times the smoothing kernel size from the sight line (2.8 Mpc), are marked with dark red symbols: plus signs correspond to locations of galaxies belonging to a filamentary environment while other galaxies are denoted with crosses. The purple vertical lines indicate the centroids of the Chandra X-ray absorption lines (F10; Z10).
Current usage metrics show cumulative count of Article Views (full-text article views including HTML views, PDF and ePub downloads, according to the available data) and Abstracts Views on Vision4Press platform.
Data correspond to usage on the plateform after 2015. The current usage metrics is available 48-96 hours after online publication and is updated daily on week days.
Initial download of the metrics may take a while.