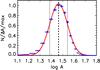
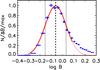
Fig. 4
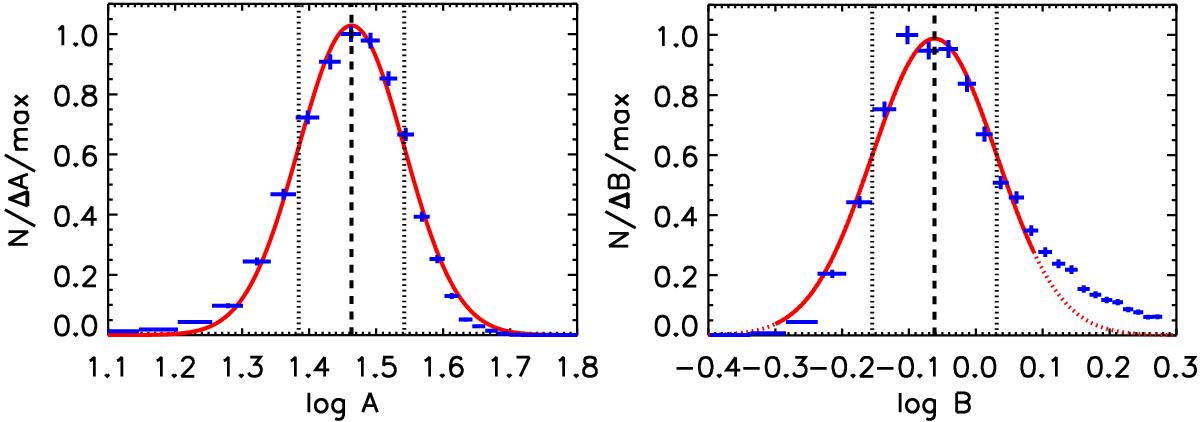
Distributions (blue crosses) of the power-law ![]() normalisation A (left panel) and the index B (right panel) when fitting the randomised LDr-WHIM density relations. The best-fit log-normal models are shown with a solid red line. The dotted red line shows the extrapolation of the best-fit model. The centroid and 68% intervals are indicated with the dashed and dotted vertical lines.
normalisation A (left panel) and the index B (right panel) when fitting the randomised LDr-WHIM density relations. The best-fit log-normal models are shown with a solid red line. The dotted red line shows the extrapolation of the best-fit model. The centroid and 68% intervals are indicated with the dashed and dotted vertical lines.
Current usage metrics show cumulative count of Article Views (full-text article views including HTML views, PDF and ePub downloads, according to the available data) and Abstracts Views on Vision4Press platform.
Data correspond to usage on the plateform after 2015. The current usage metrics is available 48-96 hours after online publication and is updated daily on week days.
Initial download of the metrics may take a while.