Free Access
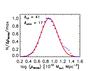
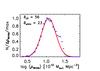
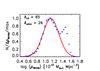
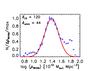
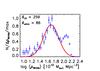
Fig. 2
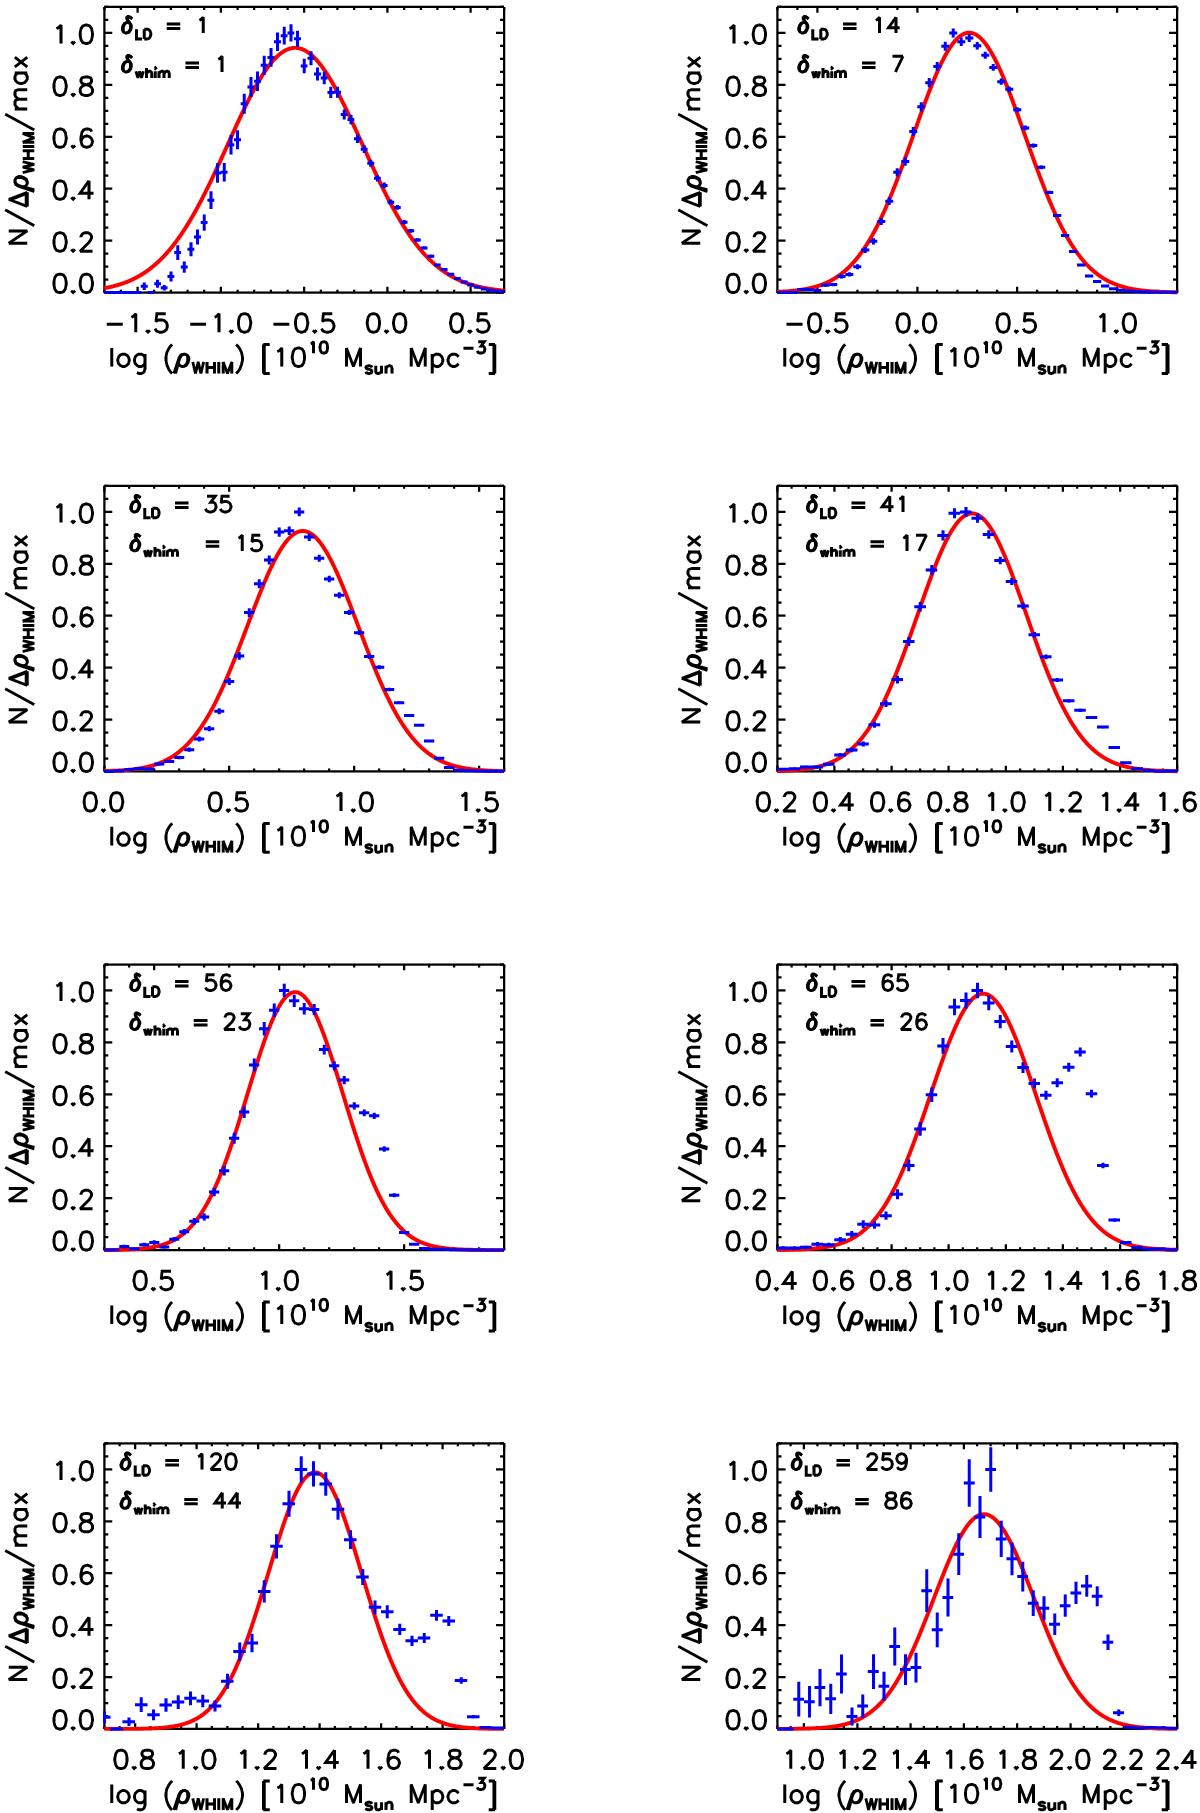
WHIM density distributions (crosses) and the best-fit log-normal models (lines) within selected LD bins. δLD indicates the central luminosity overdensity value of a given bin. δwhim indicates the WHIM overdensity value corresponding to the peak value.
This figure is made of several images, please see below:
Current usage metrics show cumulative count of Article Views (full-text article views including HTML views, PDF and ePub downloads, according to the available data) and Abstracts Views on Vision4Press platform.
Data correspond to usage on the plateform after 2015. The current usage metrics is available 48-96 hours after online publication and is updated daily on week days.
Initial download of the metrics may take a while.