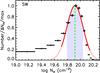
Fig. 10
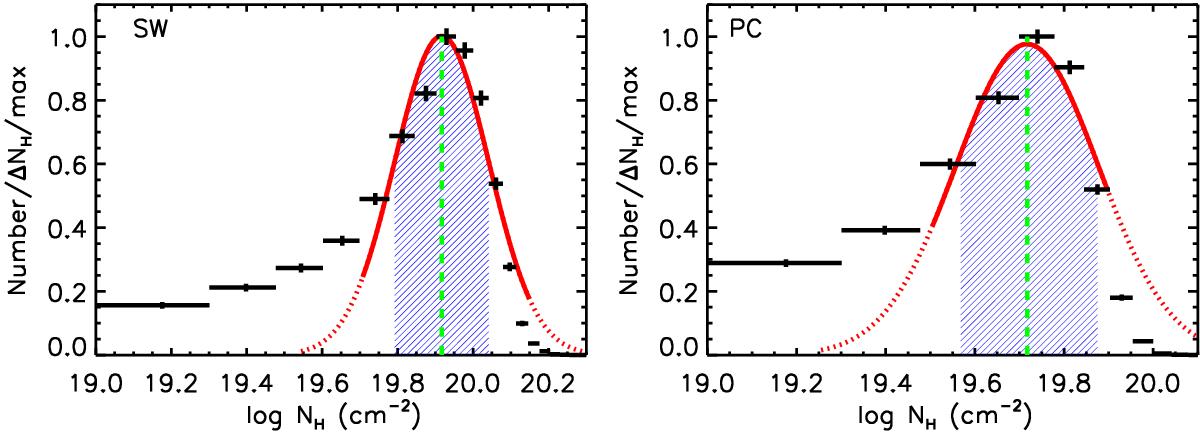
WHIM hydrogen column density distributions (black crosses) resulting from the LD–WHIM density scatter in the simulations (C12) for the SW (left panel) and PC (right panel) structures. The best-fit log-normal models (red lines) in the fitted range (solid line) are shown together with the extrapolation (dotted line). The best value and the 1σ confidence intervals are indicated with dashed green lines and the blue shaded regions, respectively.
Current usage metrics show cumulative count of Article Views (full-text article views including HTML views, PDF and ePub downloads, according to the available data) and Abstracts Views on Vision4Press platform.
Data correspond to usage on the plateform after 2015. The current usage metrics is available 48-96 hours after online publication and is updated daily on week days.
Initial download of the metrics may take a while.