Fig. 8
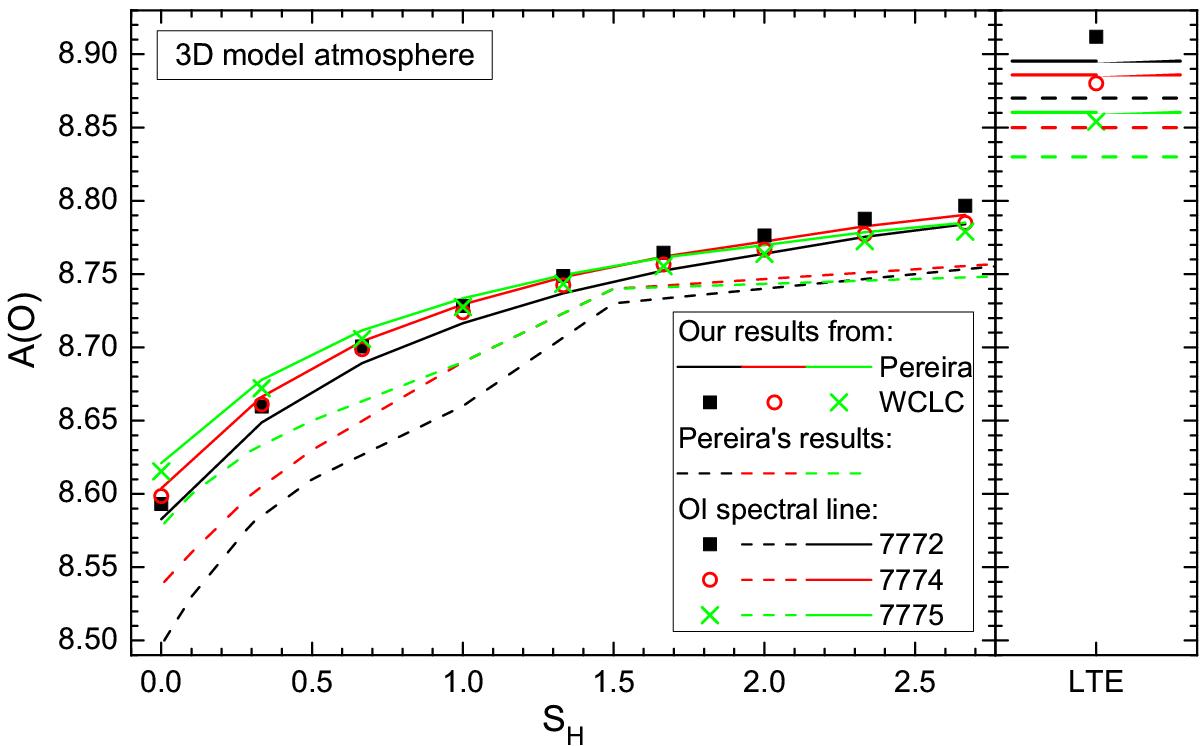
Oxygen abundance determined from disk-center line profile fitting as a function of SH for the three triplet lines and the two different observed spectra. The 3D-NLTE results of the present work (solid lines, symbols) are compared with those of Pereira et al. (2009b, Table 3, dashed lines), obtained from their profile fits of the same disk-center spectra.
Current usage metrics show cumulative count of Article Views (full-text article views including HTML views, PDF and ePub downloads, according to the available data) and Abstracts Views on Vision4Press platform.
Data correspond to usage on the plateform after 2015. The current usage metrics is available 48-96 hours after online publication and is updated daily on week days.
Initial download of the metrics may take a while.