Fig. 7
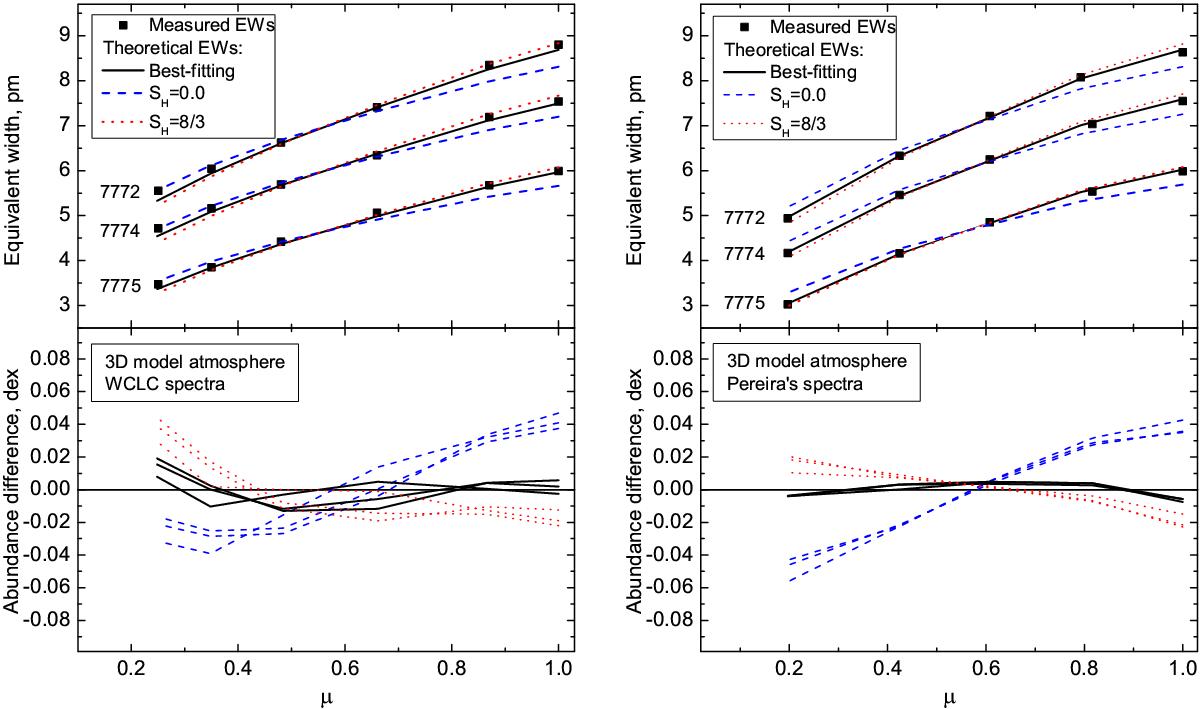
Top panels: center-to-limb variation of observed (symbols) and theoretical EWs derived from the 3D model atmosphere for SH = 0 (blue dashed), 8/3 (red dotted) and best-fit value (black solid), shown individually for the three triplet components, with wavelength increasing from top to bottom. For each SH, the corresponding A(O) is defined as the value that minimizes χ2 (Eq. (5)) at fixed SH. Bottom panels: abundance difference ![]() , where A(μ) and
, where A(μ) and ![]() denote A(O) obtained from line profile fitting at individual μ-angles and at all μ-angles simultaneously. Left and right panels refer to the WCLC and Pereira spectra, respectively.
denote A(O) obtained from line profile fitting at individual μ-angles and at all μ-angles simultaneously. Left and right panels refer to the WCLC and Pereira spectra, respectively.
Current usage metrics show cumulative count of Article Views (full-text article views including HTML views, PDF and ePub downloads, according to the available data) and Abstracts Views on Vision4Press platform.
Data correspond to usage on the plateform after 2015. The current usage metrics is available 48-96 hours after online publication and is updated daily on week days.
Initial download of the metrics may take a while.