Fig. 6
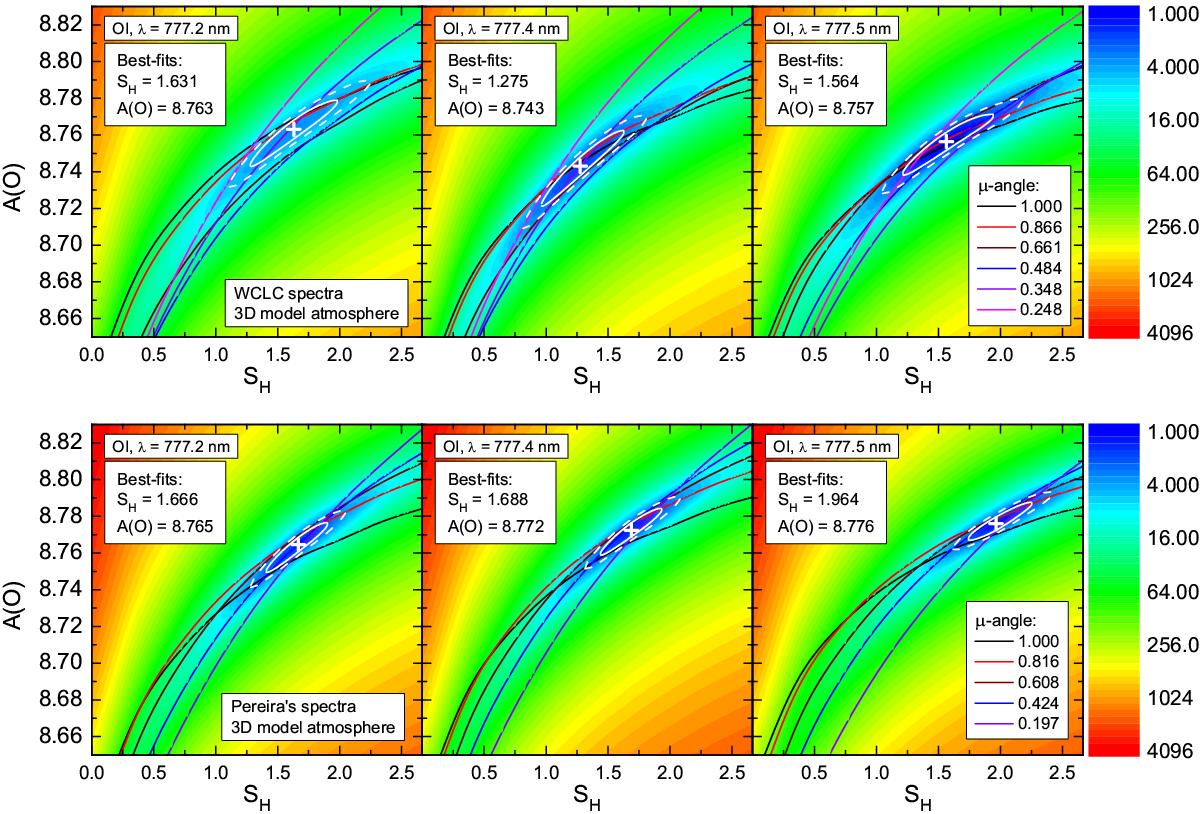
Maps of χ2 (color-coded) in the SH – A(O) plane, indicating the quality of the simultaneous fit over all μ-angles of observed and computed 3D non-LTE EW, considering each of the three triplet components separately. The location of the minium χ2 is marked by a white plus sign, while the white ellipses bound the regions where ![]() (solid) and 2.3 (dashed). The latter corresponds to the simultaneous confidence region of SH and A(O) containing 68.3% of the data if they were normally distributed. Contour lines indicating where Wobs = Wcalc are superimposed for each μ-angle. The top and bottom panels show the results for the WCLC and Pereira spectra, respectively. Line identification and best-fit parameters are given at the top left of each panel.
(solid) and 2.3 (dashed). The latter corresponds to the simultaneous confidence region of SH and A(O) containing 68.3% of the data if they were normally distributed. Contour lines indicating where Wobs = Wcalc are superimposed for each μ-angle. The top and bottom panels show the results for the WCLC and Pereira spectra, respectively. Line identification and best-fit parameters are given at the top left of each panel.
Current usage metrics show cumulative count of Article Views (full-text article views including HTML views, PDF and ePub downloads, according to the available data) and Abstracts Views on Vision4Press platform.
Data correspond to usage on the plateform after 2015. The current usage metrics is available 48-96 hours after online publication and is updated daily on week days.
Initial download of the metrics may take a while.