Fig. 3
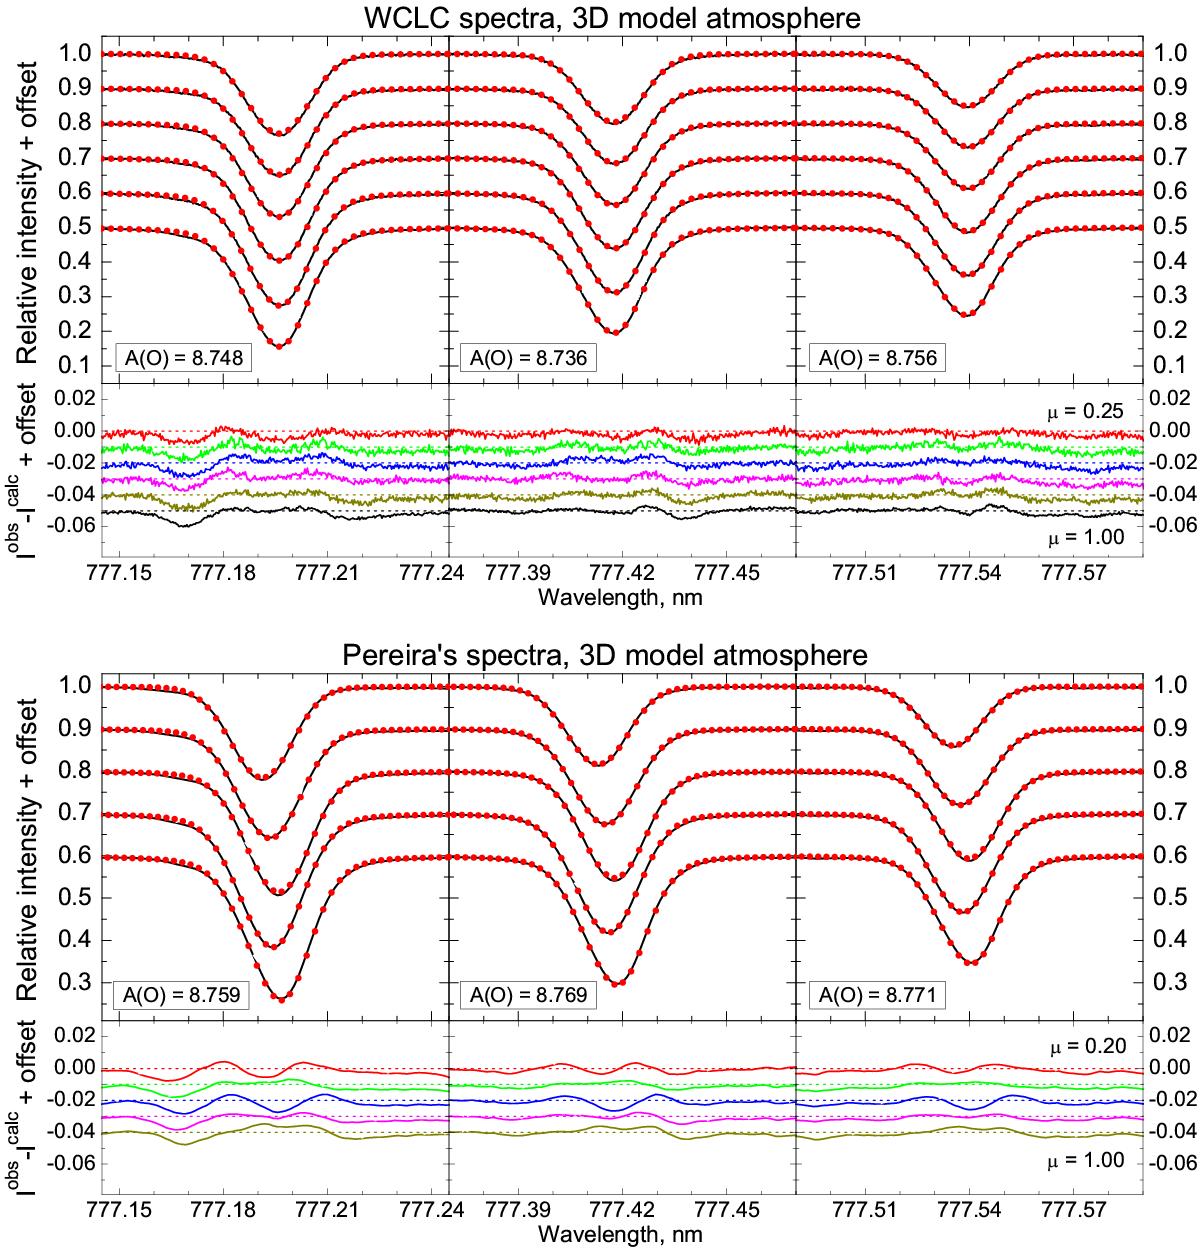
Best-fitting non-LTE line profiles computed with the 3D model atmosphere for the WCLC (top) and Pereira (bottom) spectra. The top panels show the observed spectrum (black lines) and their theoretical best-fitting counterparts (red dots) for the different μ-angles, μ increasing from top (limb) to bottom (disk center). For clarity, a vertical offset of 0.1 was applied between consecutive μ-angles. The legend shows the best-fitting A(O) value for each of the three triplet lines. The bottom panels show the difference of the normalized intensites Iobs − Icalc. An offset of 0.01 was applied between the different μ-angles (μ increasing downwards).
Current usage metrics show cumulative count of Article Views (full-text article views including HTML views, PDF and ePub downloads, according to the available data) and Abstracts Views on Vision4Press platform.
Data correspond to usage on the plateform after 2015. The current usage metrics is available 48-96 hours after online publication and is updated daily on week days.
Initial download of the metrics may take a while.