Fig. C.1
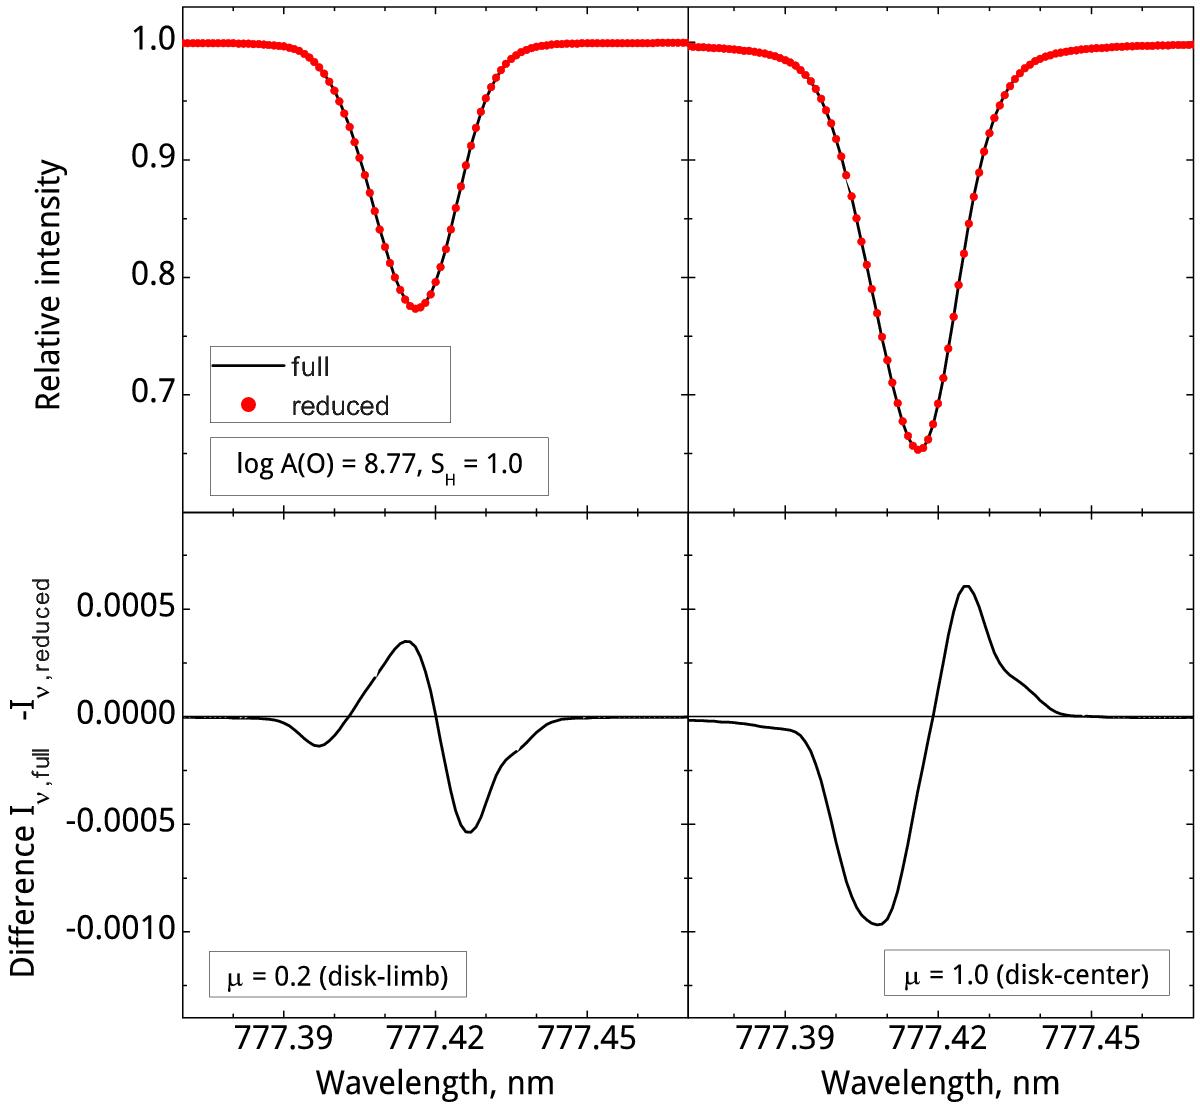
Effect of reduced horizontal resolution on the 3D-NLTE spectral line profile of the middle component of the O i IR triplet. Top panels: synthetic spectral lines computed with full resolution (black line) and with resolution reduced by a factor 3 in each horizontal direction (red dots). Bottom panels: difference in residual intensity between synthetic spectral lines computed with full and reduced horizontal resolution. A negative difference means that the spectral line computed with full resolution is stronger at the particular wavelength. Left and right panels show the results at μ = 0.2 and μ = 1.0, respectively.
Current usage metrics show cumulative count of Article Views (full-text article views including HTML views, PDF and ePub downloads, according to the available data) and Abstracts Views on Vision4Press platform.
Data correspond to usage on the plateform after 2015. The current usage metrics is available 48-96 hours after online publication and is updated daily on week days.
Initial download of the metrics may take a while.