Fig. 3
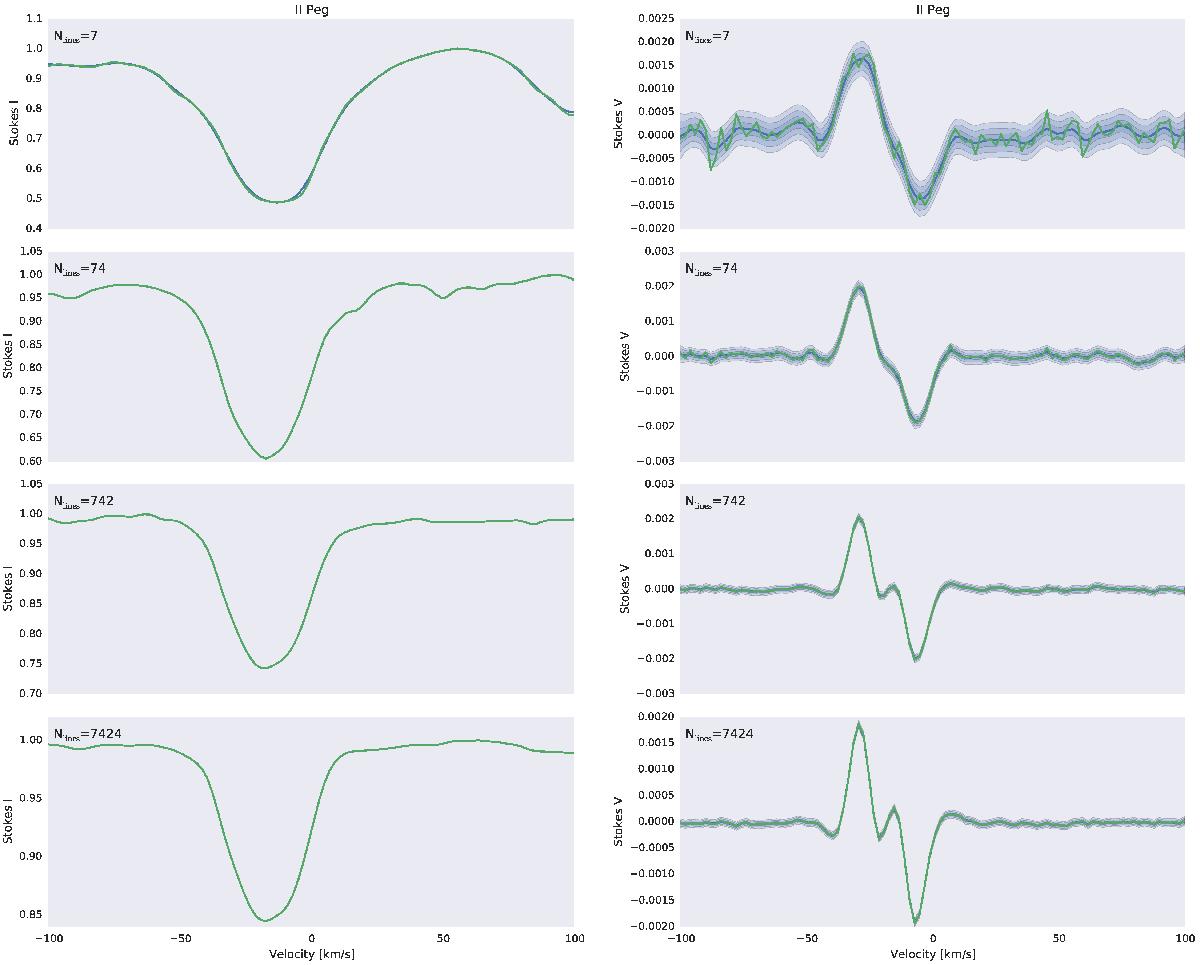
Results of applying the LSD (green curve) and Bayesian LSD (blue curve showing the mean and blue regions showing the credibility intervals) to observations of II Peg, both for Stokes I (left panel) and V (right panel). The experiments use the Matérn covariance function with ν = 3 / 2. The green and blue curves overlap almost exactly in the left panel when increasing the number of considered spectral lines.
Current usage metrics show cumulative count of Article Views (full-text article views including HTML views, PDF and ePub downloads, according to the available data) and Abstracts Views on Vision4Press platform.
Data correspond to usage on the plateform after 2015. The current usage metrics is available 48-96 hours after online publication and is updated daily on week days.
Initial download of the metrics may take a while.