Free Access
Fig. 6
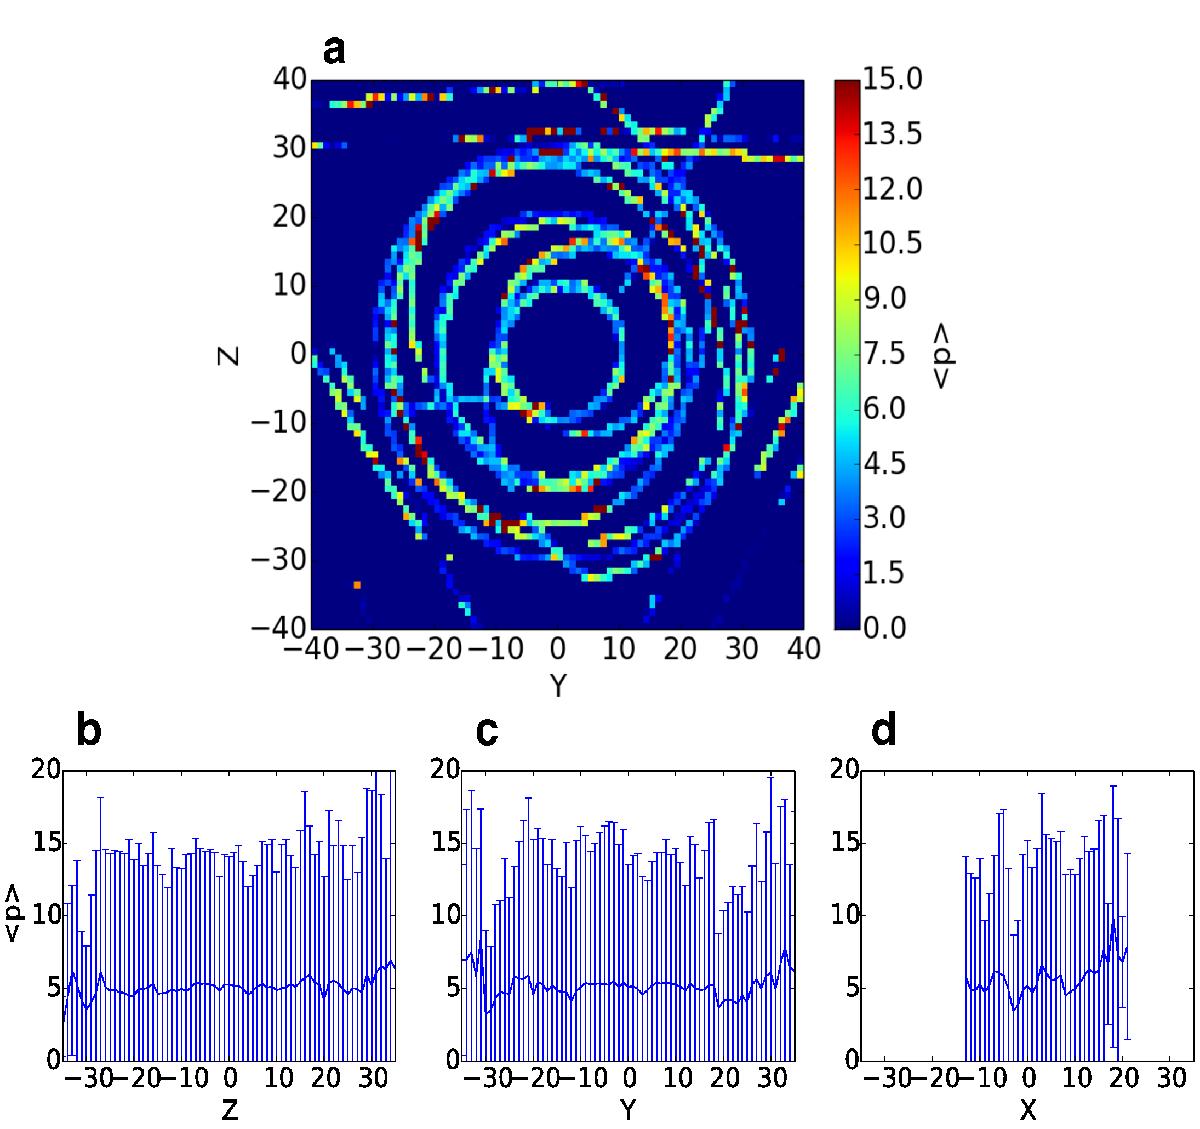
Mean value of p (see Eq. (1)) mapped along Rosetta’s trajectory in the CSO frame for the Z-Y plane (see text for definitions). Panels b), c), and d) are cuts through the z, y, and x plane respectively. Error bars represent the variance of p. Bins are 0.5 km in width.
Current usage metrics show cumulative count of Article Views (full-text article views including HTML views, PDF and ePub downloads, according to the available data) and Abstracts Views on Vision4Press platform.
Data correspond to usage on the plateform after 2015. The current usage metrics is available 48-96 hours after online publication and is updated daily on week days.
Initial download of the metrics may take a while.