Free Access
Fig. 2
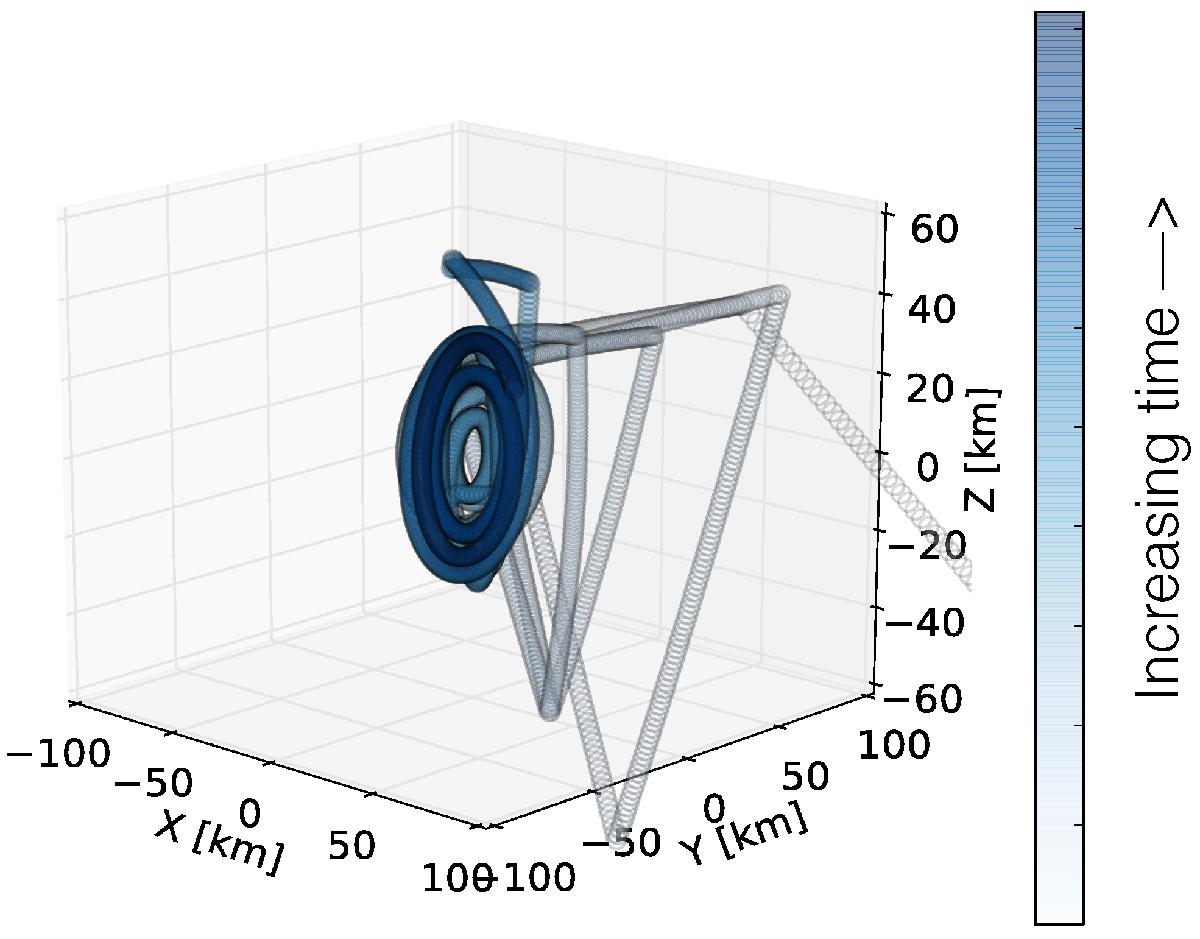
Rosetta’s trajectory from August 2014 until January 2015 (the time frame considered in this study). Elapsed time is illustrated by a darker shade of blue in the color bar.
Current usage metrics show cumulative count of Article Views (full-text article views including HTML views, PDF and ePub downloads, according to the available data) and Abstracts Views on Vision4Press platform.
Data correspond to usage on the plateform after 2015. The current usage metrics is available 48-96 hours after online publication and is updated daily on week days.
Initial download of the metrics may take a while.