Fig. 3
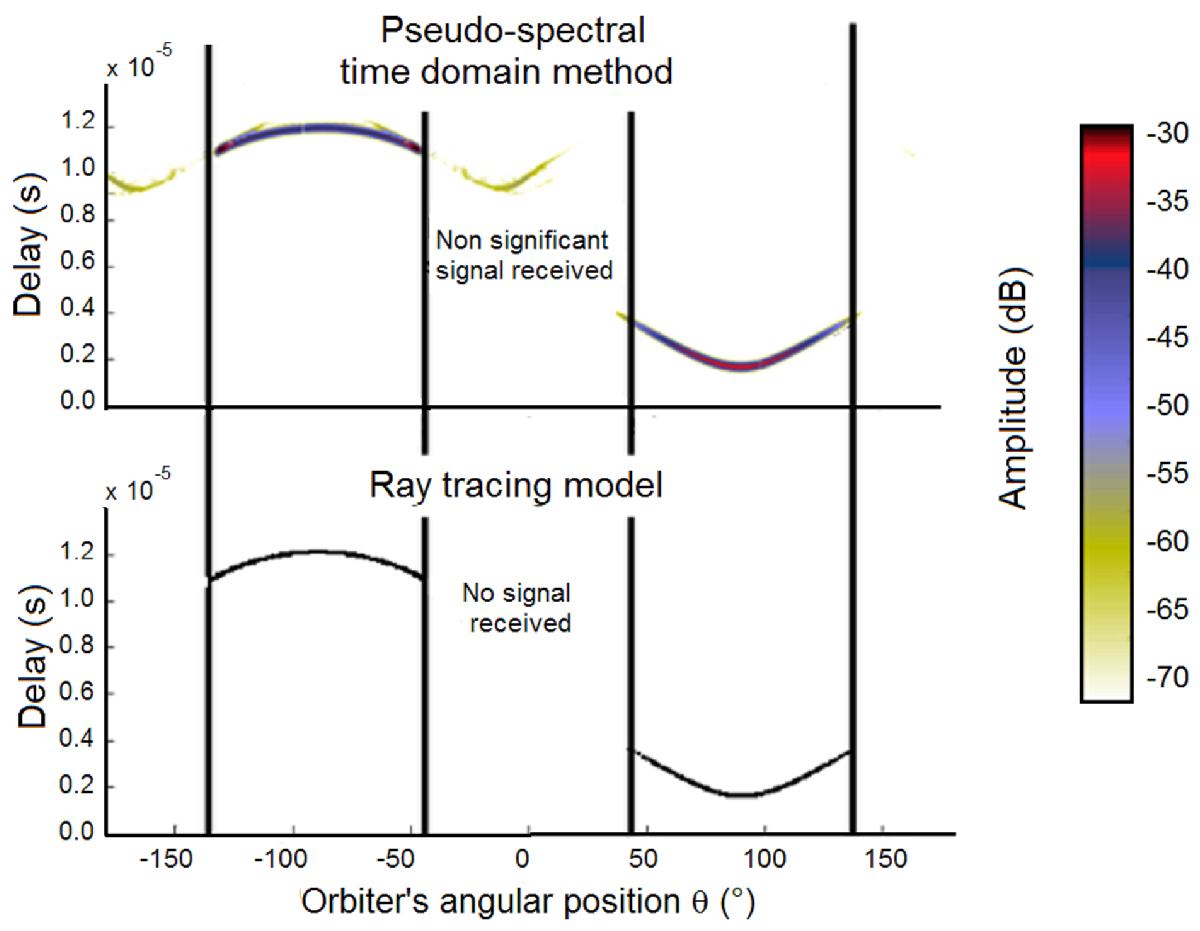
Comparison of results obtained by simulation. The plot on the top of the figure has been obtained by the pseudo-spectral time-domain method while the one at the bottom shows the result of ray tracing simulations. Delays as a function of the orbiter’s angular position are plotted whenever a signal can be detected. The vertical lines highlight the angular positions of the orbiter that limit the area where no signal or only weak signal can be detected.
Current usage metrics show cumulative count of Article Views (full-text article views including HTML views, PDF and ePub downloads, according to the available data) and Abstracts Views on Vision4Press platform.
Data correspond to usage on the plateform after 2015. The current usage metrics is available 48-96 hours after online publication and is updated daily on week days.
Initial download of the metrics may take a while.