Fig. 2
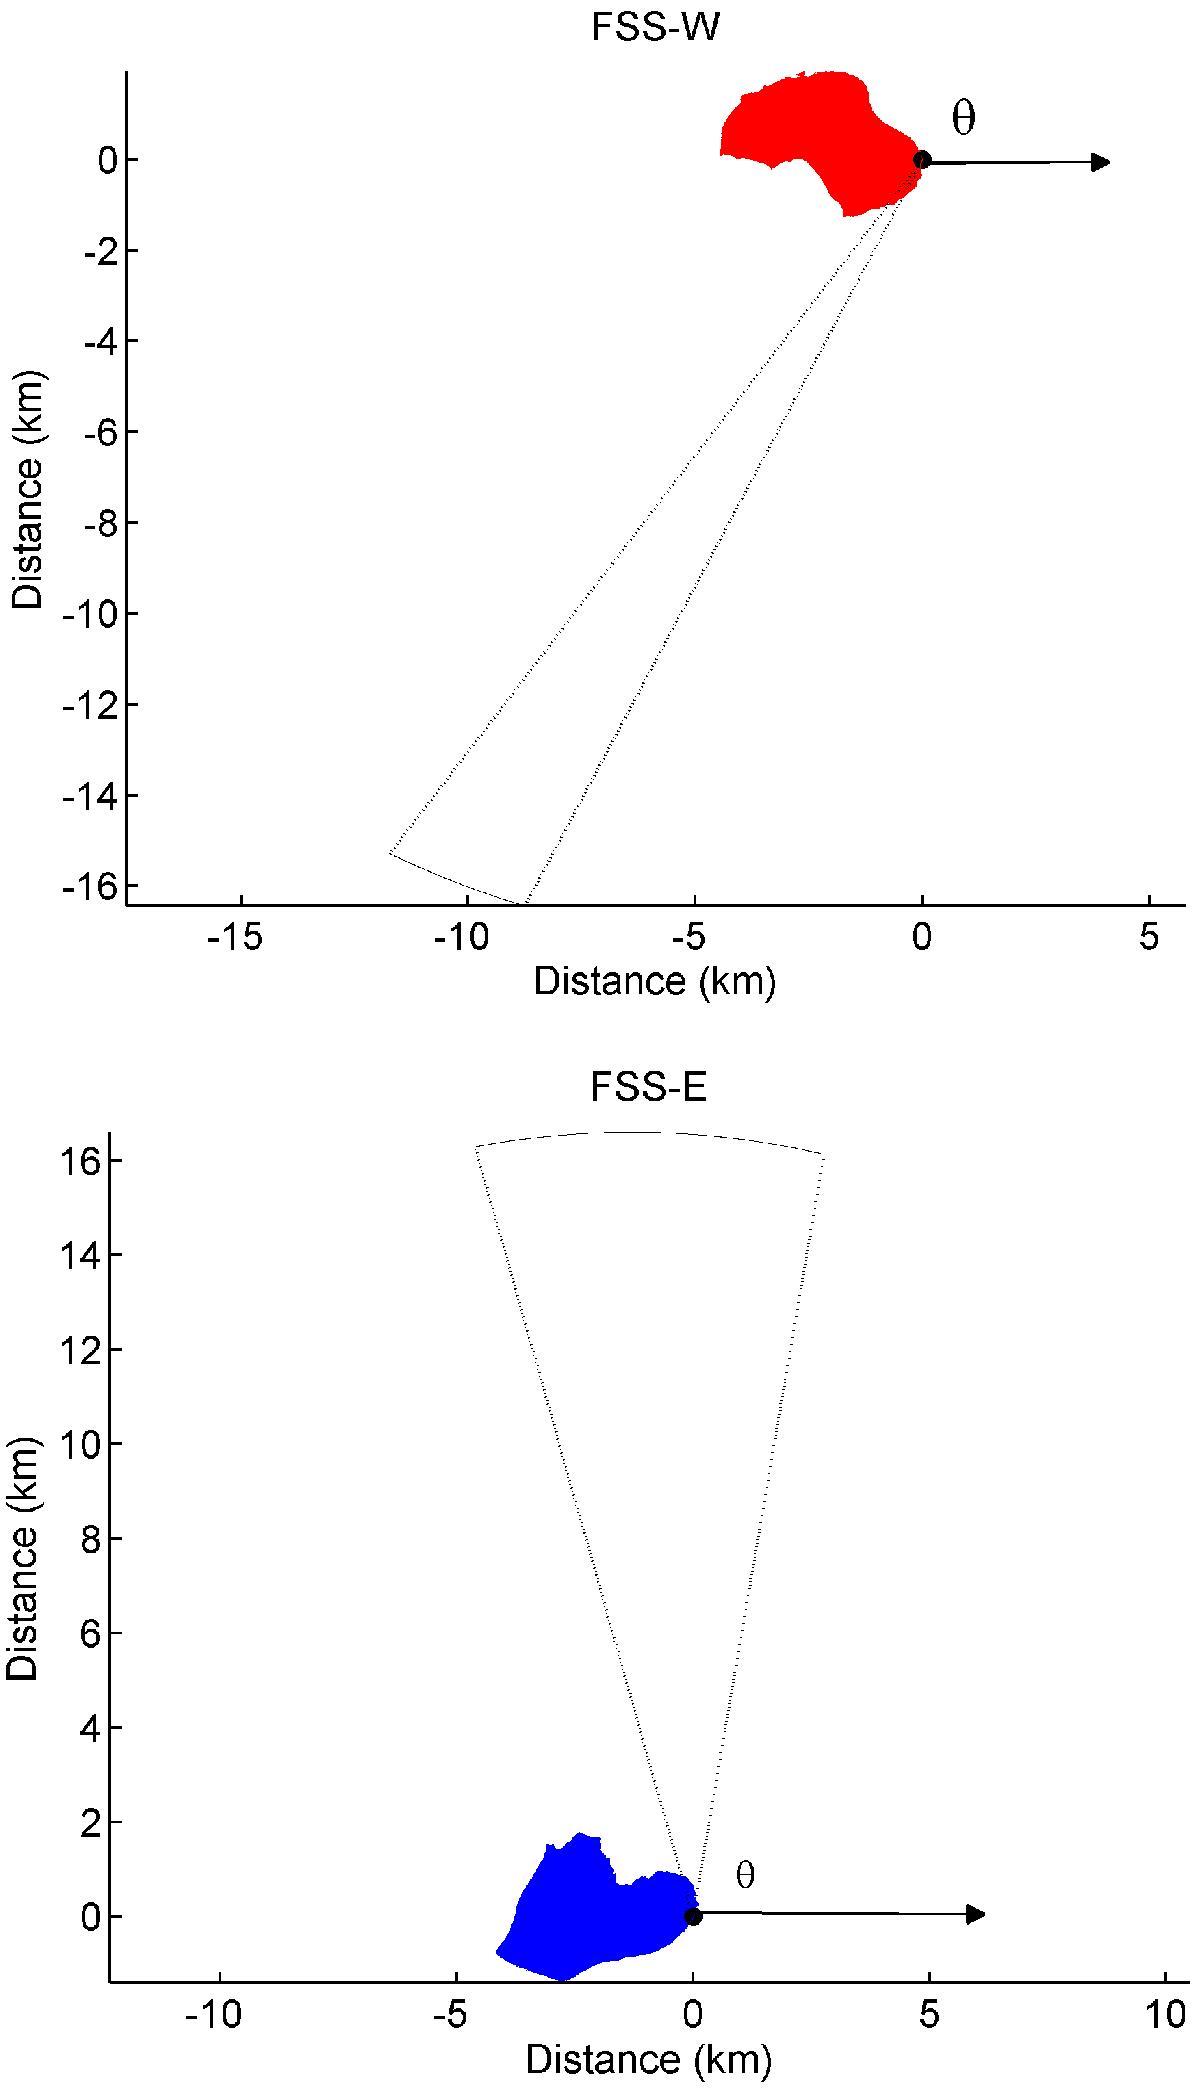
2D configuration for FSS-W (top) and FSS-E (bottom). The slice of the comet is represented in color (red for the FSS-W – blue for FSS-E); north is approximately toward the viewer. The black dot shows the lander location. The successive locations of the orbiter during these sequences of the FSS are represented in black, and the dotted lines show the variations of the orbiter apparent angular locations (θ) for each of these sequences.
Current usage metrics show cumulative count of Article Views (full-text article views including HTML views, PDF and ePub downloads, according to the available data) and Abstracts Views on Vision4Press platform.
Data correspond to usage on the plateform after 2015. The current usage metrics is available 48-96 hours after online publication and is updated daily on week days.
Initial download of the metrics may take a while.