Fig. 1
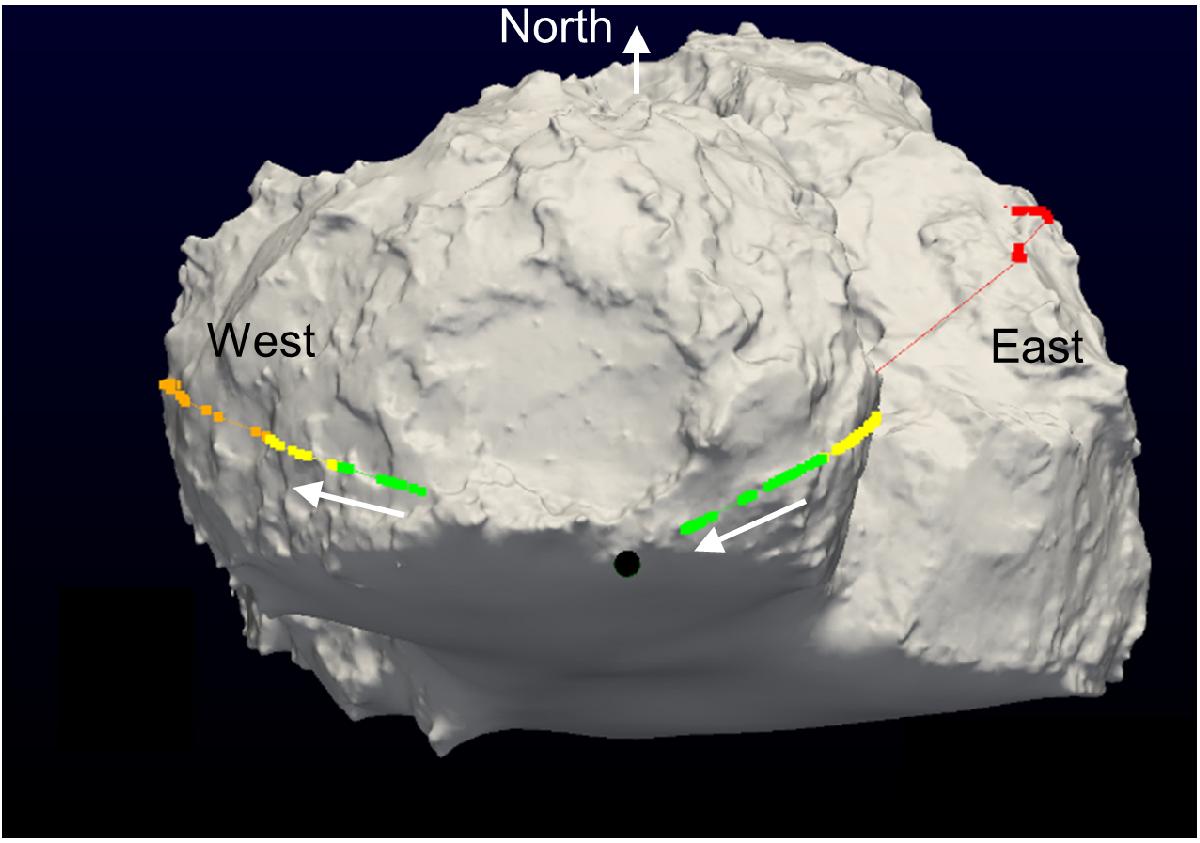
Shape model of the nucleus. The colored dots show the intersection of the straight lines joining the Rosetta orbiter to the lander with the surface of the nucleus shape model. The black dot is the location of Philae. The green dots correspond to the soundings that were performed close to the grazing angle configuration used for the study. The white arrow shows the evolution with time of the sounding locations.
Current usage metrics show cumulative count of Article Views (full-text article views including HTML views, PDF and ePub downloads, according to the available data) and Abstracts Views on Vision4Press platform.
Data correspond to usage on the plateform after 2015. The current usage metrics is available 48-96 hours after online publication and is updated daily on week days.
Initial download of the metrics may take a while.