Fig. 2
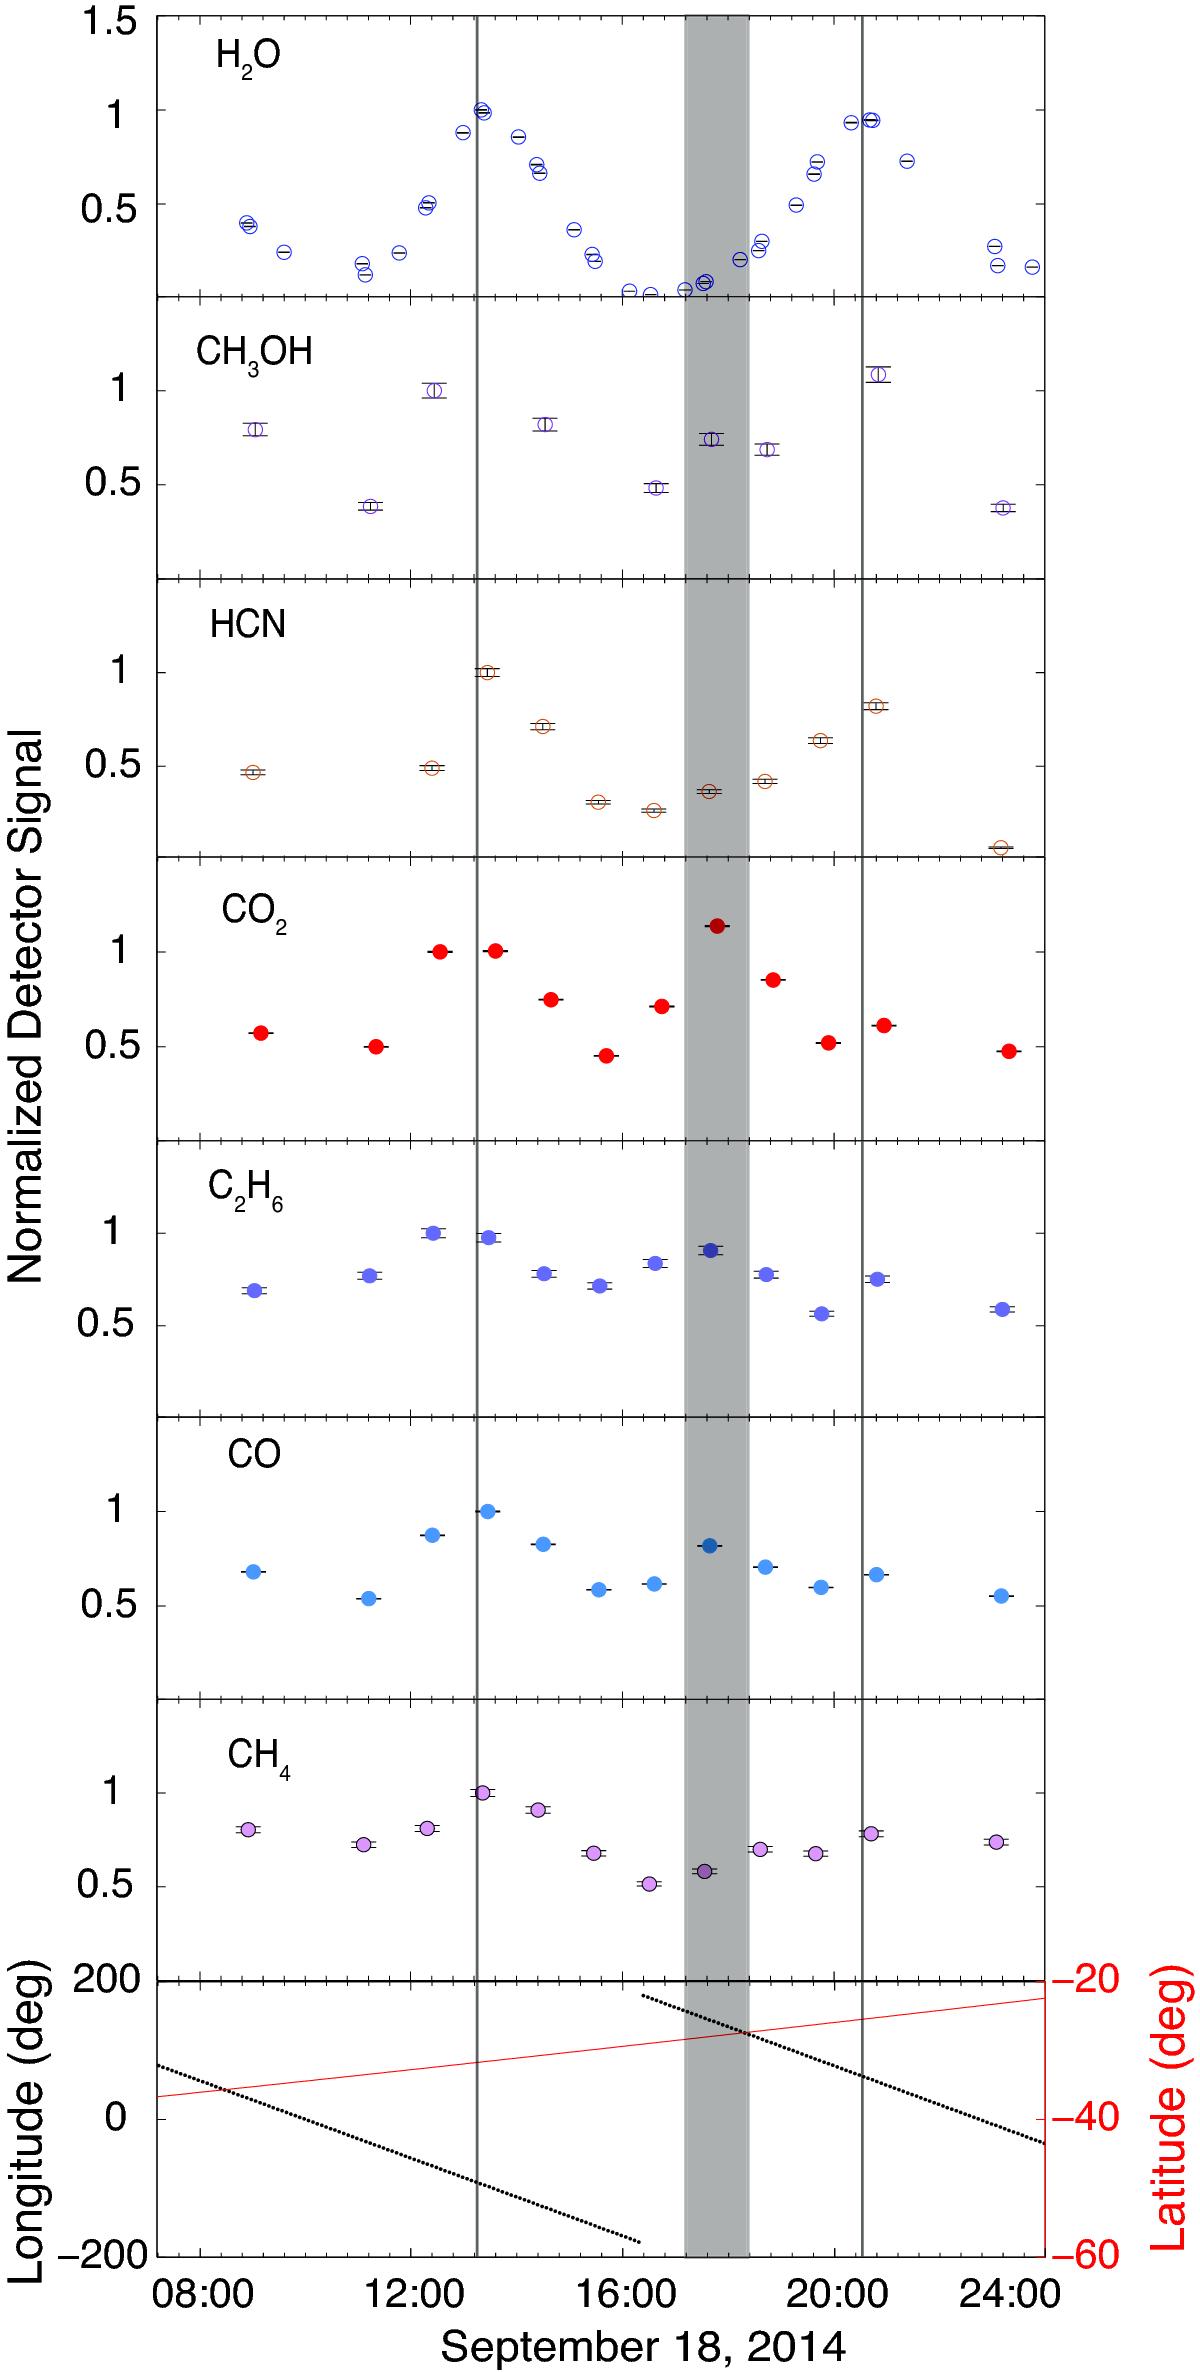
Normalized intensity profiles of various volatiles for September 18, 2014. The error bars represent the ion statistical counting uncertainty, which is calculated as ![]() (n is the number of ions detected), and in some cases, they are smaller than the symbol used (e.g., H2O). Vertical lines correspond to H2O maxima. The shaded regions correspond to the CO2, C2H6, and CO maxima independent of H2O (see text). Bottom panel: Sub-spacecraft longitude and latitude as a function of time (UT). Data gaps are due to reaction wheel offloading. The distance of Rosetta from the comet nucleus was 28.6 km, and the heliocentric distance on this date was 3.34 AU.
(n is the number of ions detected), and in some cases, they are smaller than the symbol used (e.g., H2O). Vertical lines correspond to H2O maxima. The shaded regions correspond to the CO2, C2H6, and CO maxima independent of H2O (see text). Bottom panel: Sub-spacecraft longitude and latitude as a function of time (UT). Data gaps are due to reaction wheel offloading. The distance of Rosetta from the comet nucleus was 28.6 km, and the heliocentric distance on this date was 3.34 AU.
Current usage metrics show cumulative count of Article Views (full-text article views including HTML views, PDF and ePub downloads, according to the available data) and Abstracts Views on Vision4Press platform.
Data correspond to usage on the plateform after 2015. The current usage metrics is available 48-96 hours after online publication and is updated daily on week days.
Initial download of the metrics may take a while.