Fig. 7
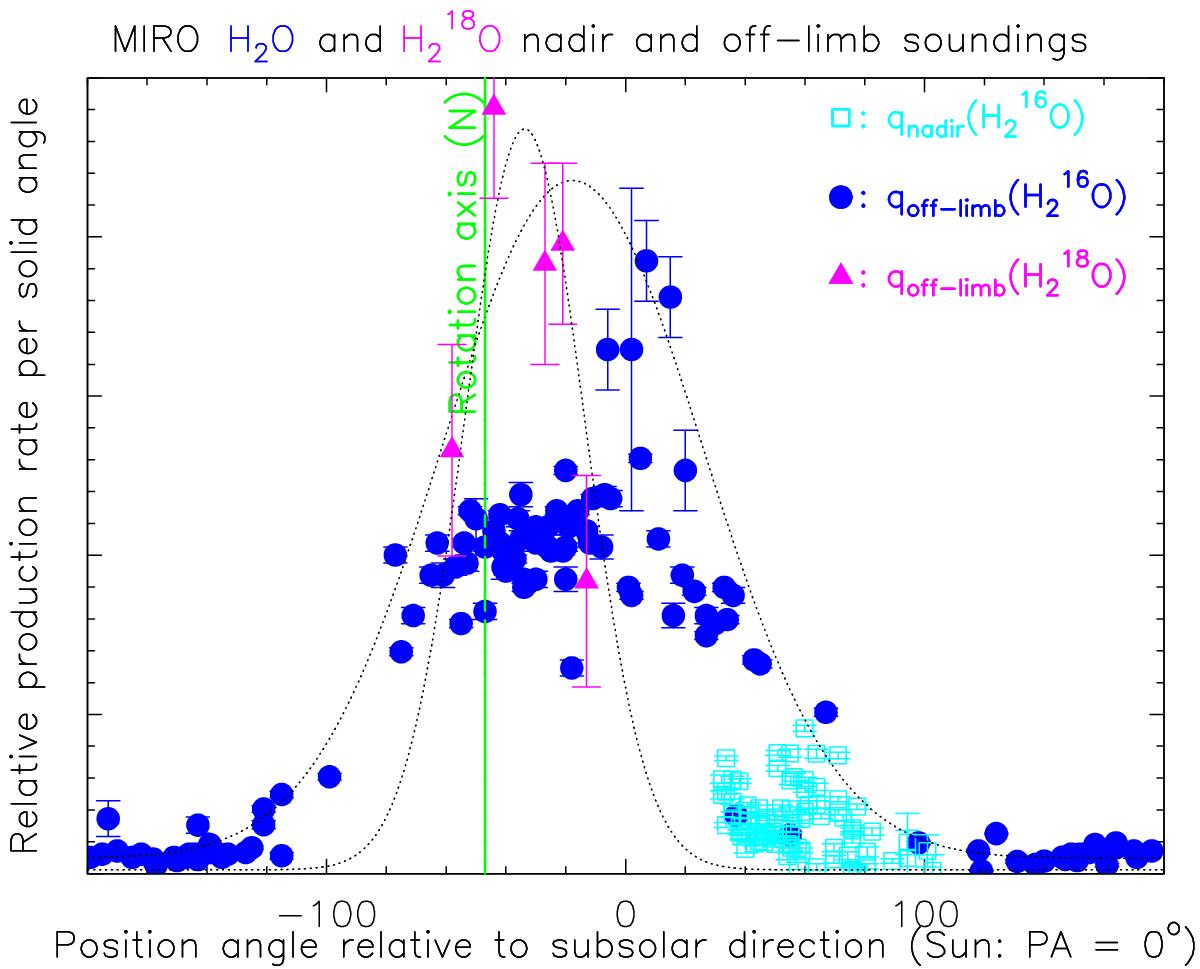
Production rates per solid angle derived for each point versus their angular position in the plane of sky relative to the direction of the Sun. For measurements against the nucleus, we have determined a rough position angle between the plane containing the targeted point (assumed to be at 2 km from the center) and the terminator and the plane of the sky. These nadir-directed points are shown as light squares. There is a clear peak in emission between angles of –100 and +60°, forming a broad jet from a region on the nucleus including the subsolar point and the north pole. Independent Gaussian fits to the H![]() O and H
O and H![]() O data are plotted as dotted lines. The vertical scale for H
O data are plotted as dotted lines. The vertical scale for H![]() O has been multiplied by 125 relative to H
O has been multiplied by 125 relative to H![]() O for legibility, but we would expect a factor ≈4 more (matching the expected 16O/18O ratio of 500) with a better modeled opacity. The H
O for legibility, but we would expect a factor ≈4 more (matching the expected 16O/18O ratio of 500) with a better modeled opacity. The H![]() O production rates (blue dots and squares) are very likely underestimated because the line is not fully modeled due to saturation (Fig. 4-(1)) in the region –70 to 0°, which explains the broader angular shape. Nadir points (squares) suggest that the jet probably is narrower in the plane of the line of sight and Sun direction.
O production rates (blue dots and squares) are very likely underestimated because the line is not fully modeled due to saturation (Fig. 4-(1)) in the region –70 to 0°, which explains the broader angular shape. Nadir points (squares) suggest that the jet probably is narrower in the plane of the line of sight and Sun direction.
Current usage metrics show cumulative count of Article Views (full-text article views including HTML views, PDF and ePub downloads, according to the available data) and Abstracts Views on Vision4Press platform.
Data correspond to usage on the plateform after 2015. The current usage metrics is available 48-96 hours after online publication and is updated daily on week days.
Initial download of the metrics may take a while.