Fig. 6
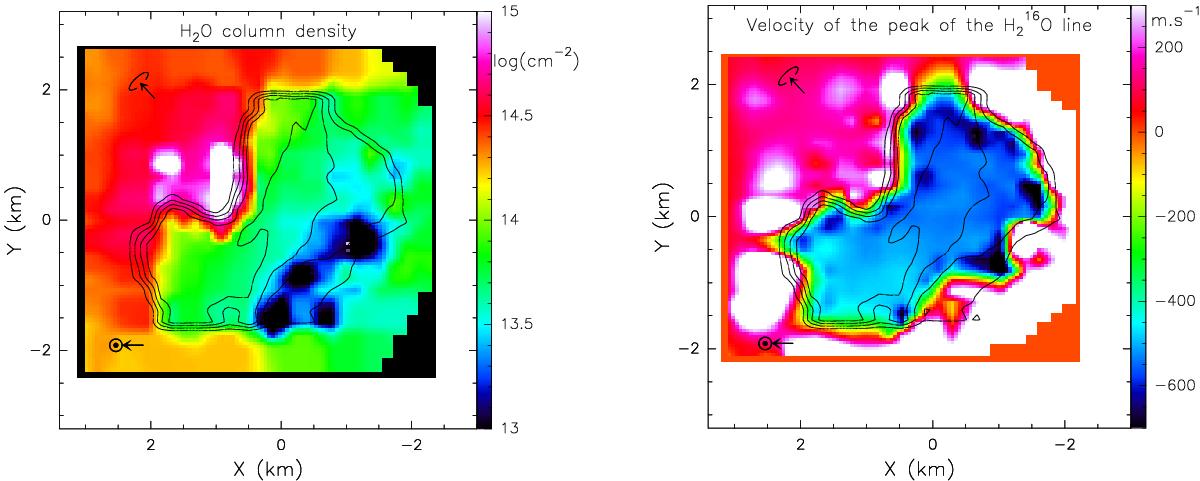
Left: Log scale plot of the derived water column density around the nucleus of 67P. Color-coded scale in log(molec cm-2 ) is given at the right. Right: values of the peak velocity of the H![]() O line (from Gaussian-fitting the strongest component). Negative velocities, seen against the nucleus from lines in absorption, indicate a flow towards the observer. Off the nucleus, the line is mostly redshifted (positive velocities) as a result of self-absorption of the foreground part of the coma in the optically thick H
O line (from Gaussian-fitting the strongest component). Negative velocities, seen against the nucleus from lines in absorption, indicate a flow towards the observer. Off the nucleus, the line is mostly redshifted (positive velocities) as a result of self-absorption of the foreground part of the coma in the optically thick H![]() O line, which causes gas moving away from us on the far side of the nucleus to dominate the spectrum. Contours of the continuum level (in black), locating the nucleus, are superimposed. The direction of the Sun and north pole rotation axis are also shown.
O line, which causes gas moving away from us on the far side of the nucleus to dominate the spectrum. Contours of the continuum level (in black), locating the nucleus, are superimposed. The direction of the Sun and north pole rotation axis are also shown.
Current usage metrics show cumulative count of Article Views (full-text article views including HTML views, PDF and ePub downloads, according to the available data) and Abstracts Views on Vision4Press platform.
Data correspond to usage on the plateform after 2015. The current usage metrics is available 48-96 hours after online publication and is updated daily on week days.
Initial download of the metrics may take a while.