Fig. 5
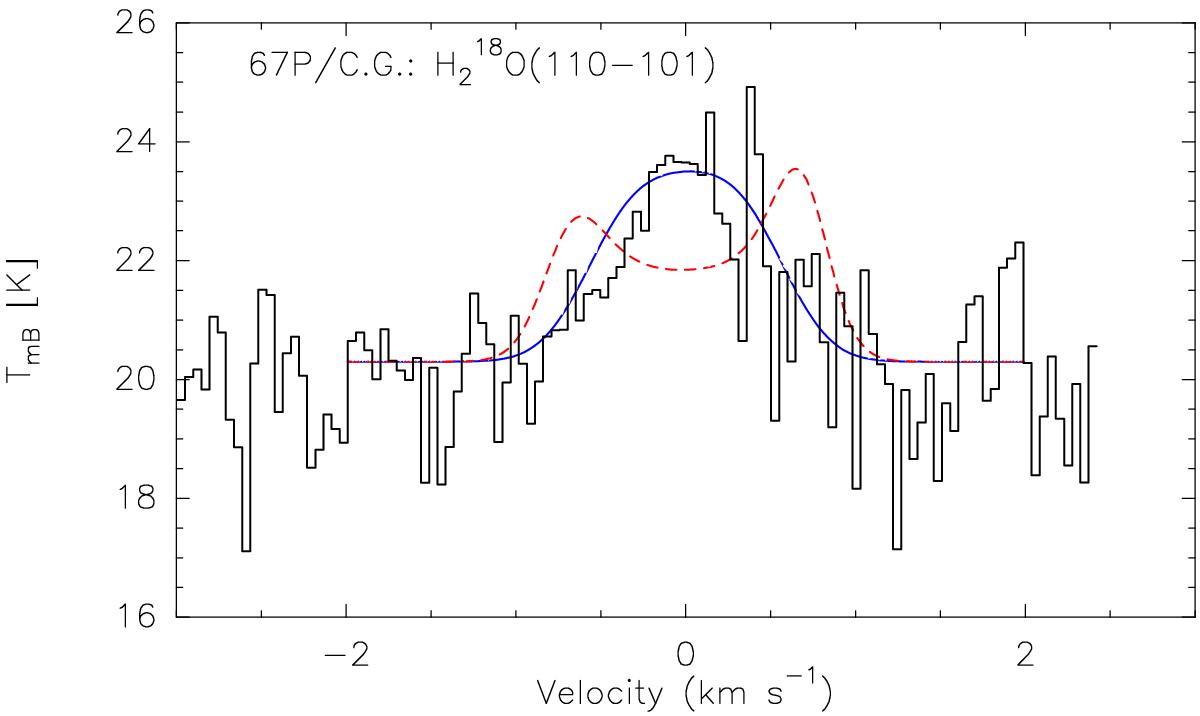
Spectrum of H![]() O from averaging the four strongest emission lines in the pole region of Fig. 3. The line width (1.01 ± 0.1 km s-1) is lower than expected for isotropic outgassing at vexp = 0.70 km s-1 (FWHM = 1.36 km s-1 with a double peak, dashed line). If we assume that most of the outgassing is limited to a restricted cone (φ = 90 ± 48°, θ = ± 48°, see text), we obtain a reasonable agreement to the line shape (superimposed continuous profile, with
O from averaging the four strongest emission lines in the pole region of Fig. 3. The line width (1.01 ± 0.1 km s-1) is lower than expected for isotropic outgassing at vexp = 0.70 km s-1 (FWHM = 1.36 km s-1 with a double peak, dashed line). If we assume that most of the outgassing is limited to a restricted cone (φ = 90 ± 48°, θ = ± 48°, see text), we obtain a reasonable agreement to the line shape (superimposed continuous profile, with ![]() molec s-1). Part of the background continuum of the nucleus is also seen and modeled.
molec s-1). Part of the background continuum of the nucleus is also seen and modeled.
Current usage metrics show cumulative count of Article Views (full-text article views including HTML views, PDF and ePub downloads, according to the available data) and Abstracts Views on Vision4Press platform.
Data correspond to usage on the plateform after 2015. The current usage metrics is available 48-96 hours after online publication and is updated daily on week days.
Initial download of the metrics may take a while.