Fig. 4
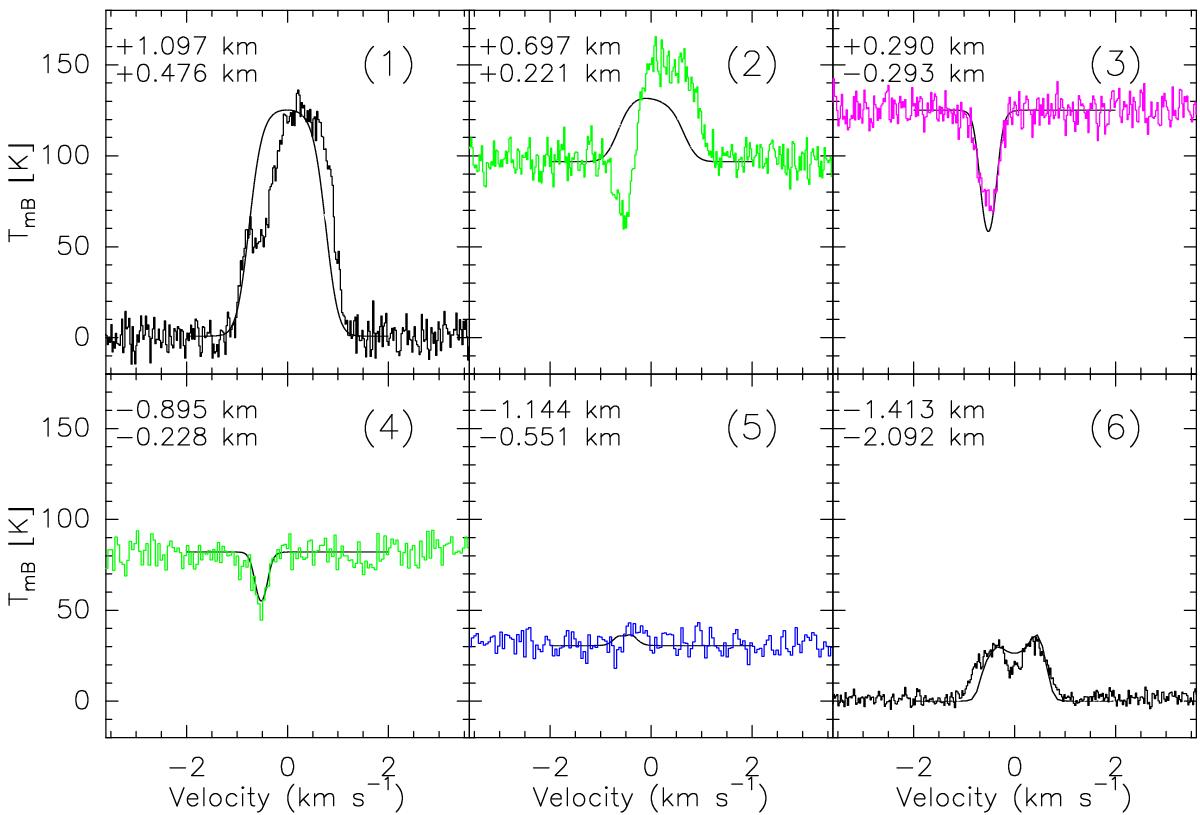
Six spectra of the H![]() O line at 556.936 GHz observed with MIRO extracted from the map in Fig. 2, approximately along the projected rotation axis of comet 67P. The pointing offsets in meters relative to the direction of the center of the nucleus are given in the upper left corner of each spectrum. The continuum level has been added and color coded as in Fig. 2. The six spectra labeled (1)–(6) illustrate the corresponding cases in Sect. 3. We note that in the cases (3)–(5) the line is either weakly in emission or in absorption, but only at negative velocities, i.e., coming from gas moving toward Rosetta/MIRO, because the nucleus shields the coma emission from the far side of the comet. The scales are the same for all spectra: −20 to +180 K in TmB (vertical axis) and −3.6 to +3.6 km s-1 in Doppler velocity relative to the nucleus (horizontal axis). Simulated profiles (smooth black curves) obtained with the parameters of Table 2 are superimposed.
O line at 556.936 GHz observed with MIRO extracted from the map in Fig. 2, approximately along the projected rotation axis of comet 67P. The pointing offsets in meters relative to the direction of the center of the nucleus are given in the upper left corner of each spectrum. The continuum level has been added and color coded as in Fig. 2. The six spectra labeled (1)–(6) illustrate the corresponding cases in Sect. 3. We note that in the cases (3)–(5) the line is either weakly in emission or in absorption, but only at negative velocities, i.e., coming from gas moving toward Rosetta/MIRO, because the nucleus shields the coma emission from the far side of the comet. The scales are the same for all spectra: −20 to +180 K in TmB (vertical axis) and −3.6 to +3.6 km s-1 in Doppler velocity relative to the nucleus (horizontal axis). Simulated profiles (smooth black curves) obtained with the parameters of Table 2 are superimposed.
Current usage metrics show cumulative count of Article Views (full-text article views including HTML views, PDF and ePub downloads, according to the available data) and Abstracts Views on Vision4Press platform.
Data correspond to usage on the plateform after 2015. The current usage metrics is available 48-96 hours after online publication and is updated daily on week days.
Initial download of the metrics may take a while.