Fig. 3
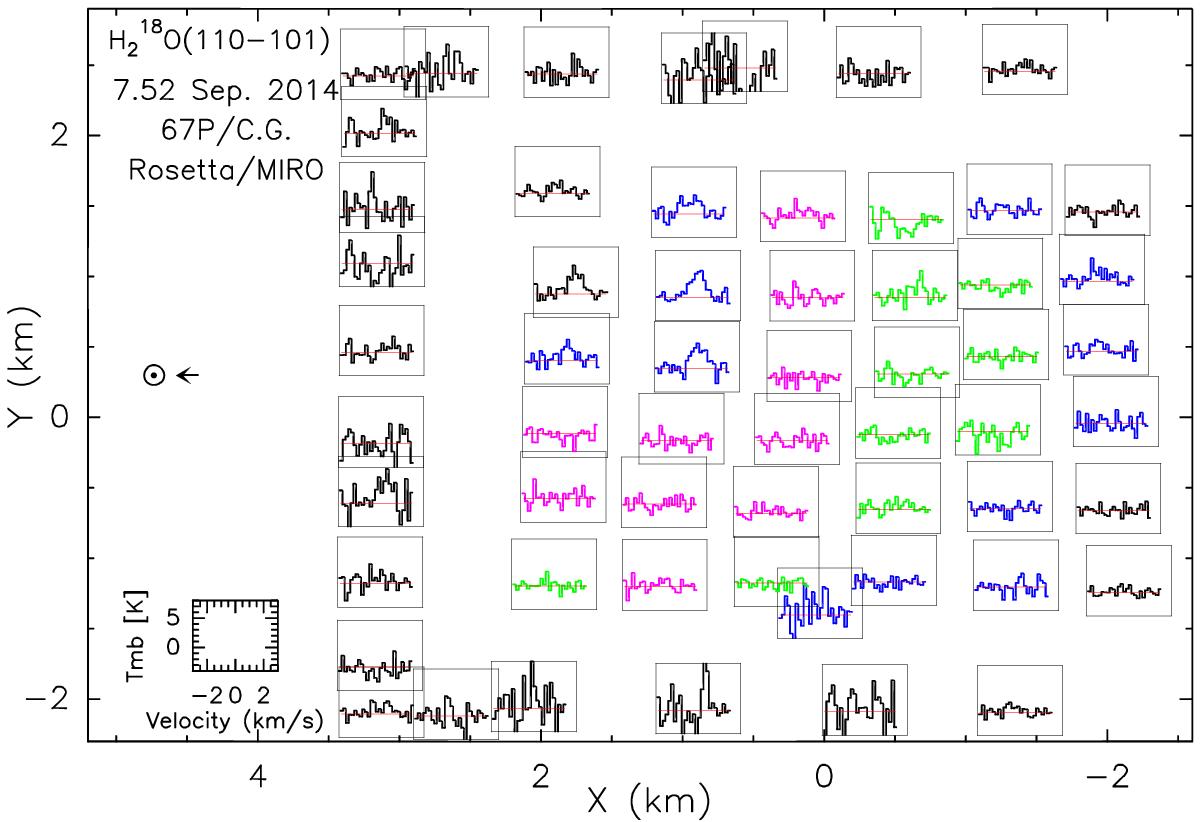
58 spectra of the H![]() O line at 547.676 GHz observed with MIRO between 10h35 and 14h22 UT on 7 September 2014. This map covers the same observations as in Fig. 2, but with a larger binning of 750 × 510 m. The spectra have been also color coded according to the average background submillimeter continuum level: black: < 3 K, blue: 3−50 K, green: 50−100 K, pink: 100−150 K, and red >150 K. The line is only clearly seen in emission, while above the neck/subsolar region, 2.0 >X> 0.5 km and 1.5 >Y> 0 km The scales are the same for all spectra: –4 to +8 K in TmB (vertical axis) and –3 to +3 km s-1 in Doppler velocity relative to the nucleus (horizontal axis).
O line at 547.676 GHz observed with MIRO between 10h35 and 14h22 UT on 7 September 2014. This map covers the same observations as in Fig. 2, but with a larger binning of 750 × 510 m. The spectra have been also color coded according to the average background submillimeter continuum level: black: < 3 K, blue: 3−50 K, green: 50−100 K, pink: 100−150 K, and red >150 K. The line is only clearly seen in emission, while above the neck/subsolar region, 2.0 >X> 0.5 km and 1.5 >Y> 0 km The scales are the same for all spectra: –4 to +8 K in TmB (vertical axis) and –3 to +3 km s-1 in Doppler velocity relative to the nucleus (horizontal axis).
Current usage metrics show cumulative count of Article Views (full-text article views including HTML views, PDF and ePub downloads, according to the available data) and Abstracts Views on Vision4Press platform.
Data correspond to usage on the plateform after 2015. The current usage metrics is available 48-96 hours after online publication and is updated daily on week days.
Initial download of the metrics may take a while.